Graphs Worksheets for 7-Year-Olds
13 filtered results
-
From - To
Introducing our captivating collection of Graphs for 7-Year-Olds worksheets! Specially designed to inspire young minds, these worksheets are the perfect blend of fun and learning. Tailored to help 7-year-olds grasp the basics of graphing, this collection includes a variety of engaging exercises. From understanding bar graphs to pie charts, and everything in between, these worksheets make learning graphs an exciting adventure. With vibrant illustrations and simple instructions, our Graphs for 7-Year-Olds worksheets are not just educational tools but also a way to spark curiosity and foster a love for mathematics in your child. Dive into the world of graphs with your 7-year-old today!
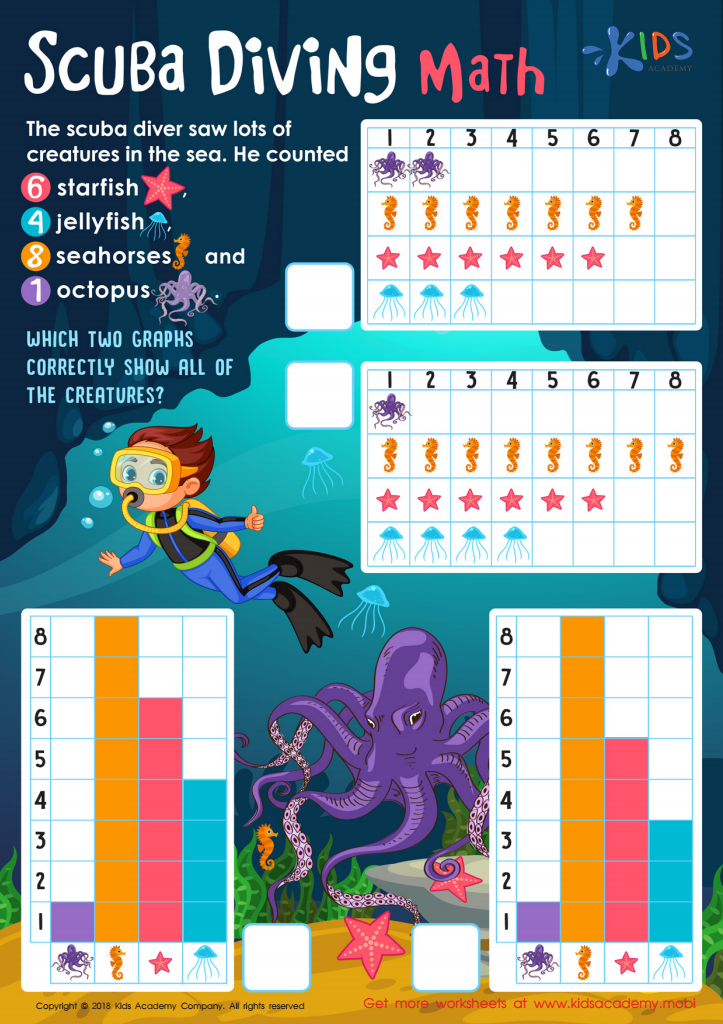
Scuba Diving Math Worksheet
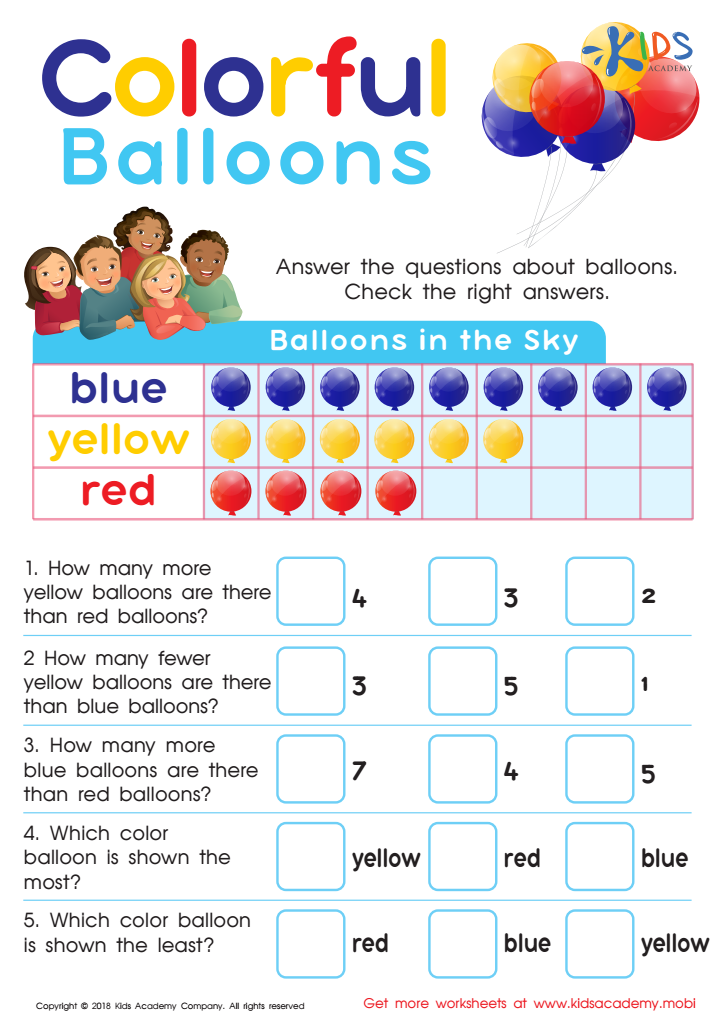
Picture Graphs: Colorful Balloons Worksheet
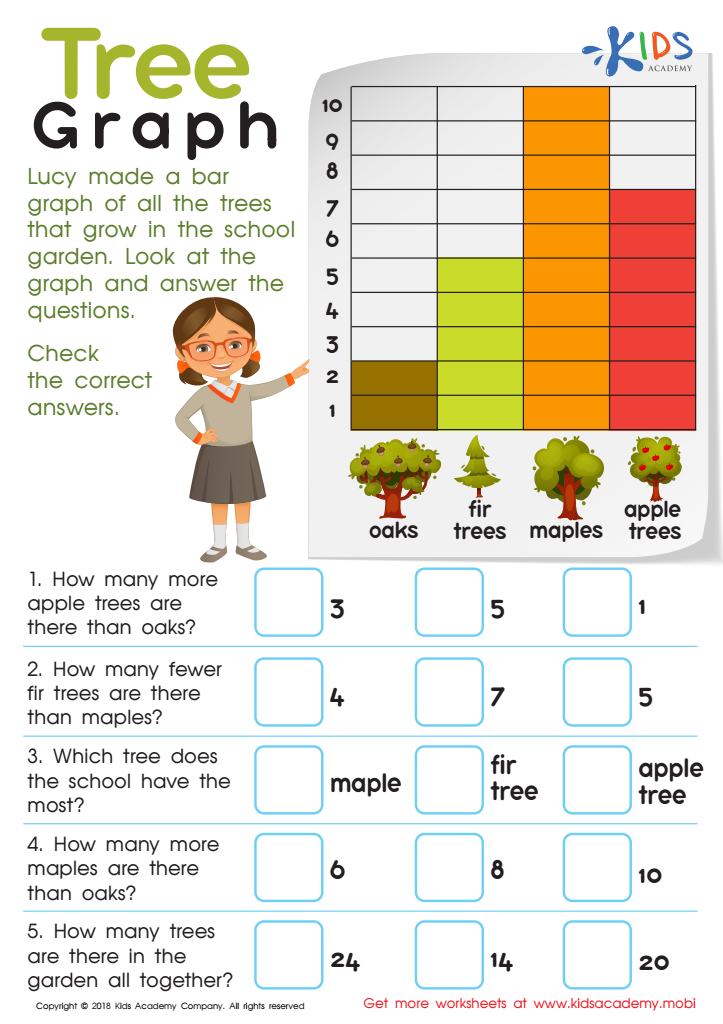
Tree Graph Worksheet
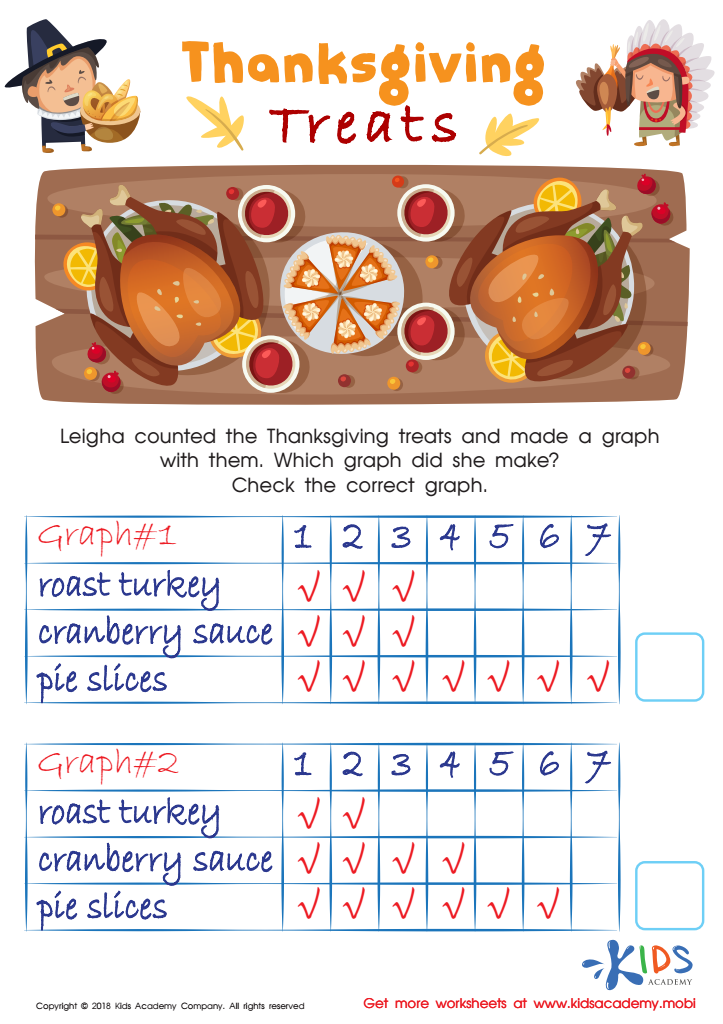
Graphs: Thanksgiving Treats Worksheet

Fruit Math: Picture Graphs Worksheet
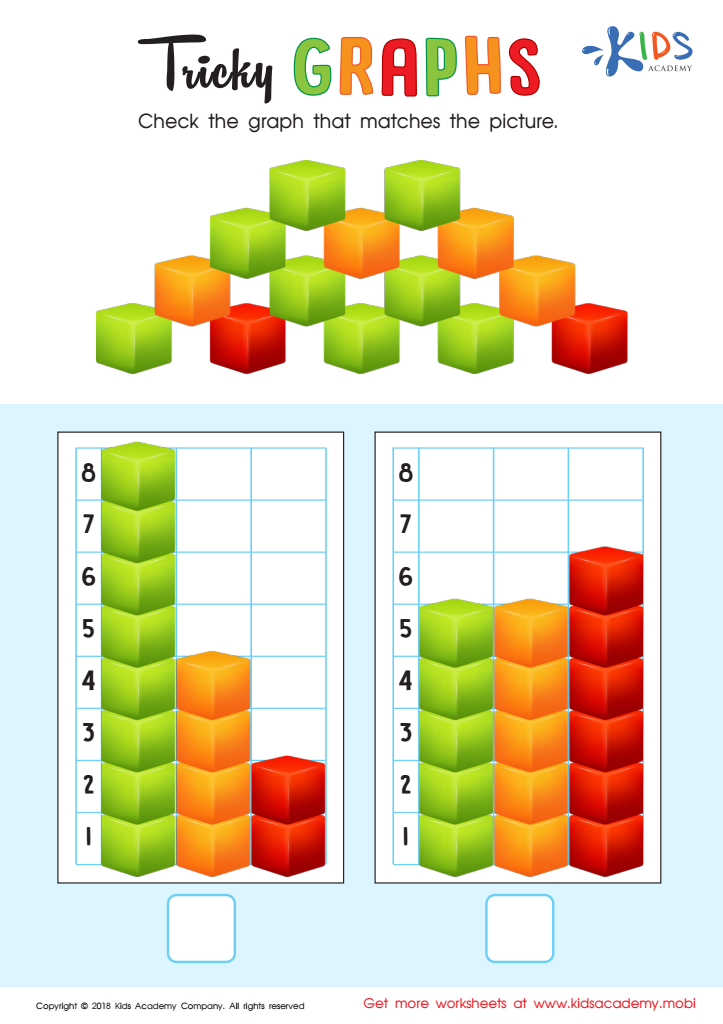
Tricky Graphs Worksheet

Match Tally Marks to Bar Graphs Worksheet
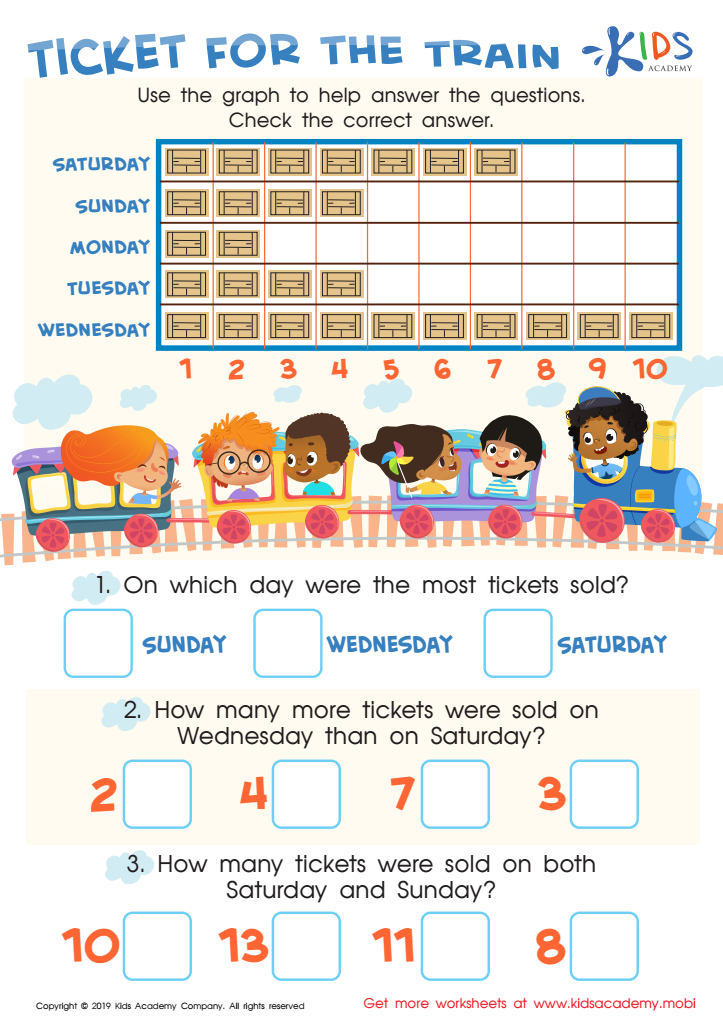
Ticket for the Train Worksheet

Graph: Baby Animals Worksheet
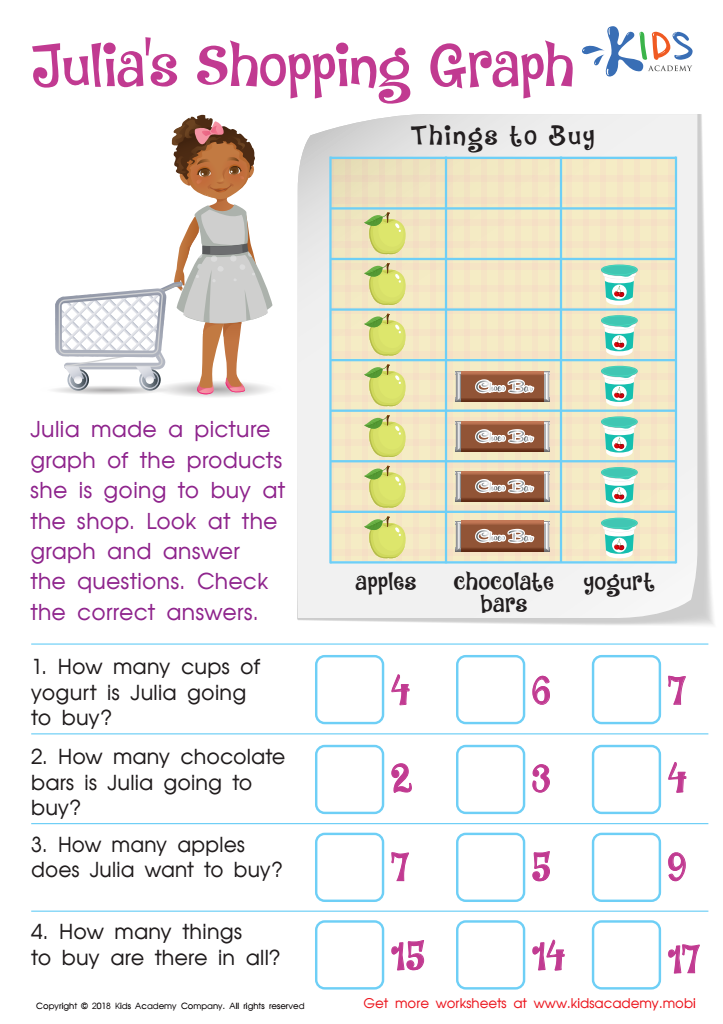
Julia's Shopping Graph Worksheet
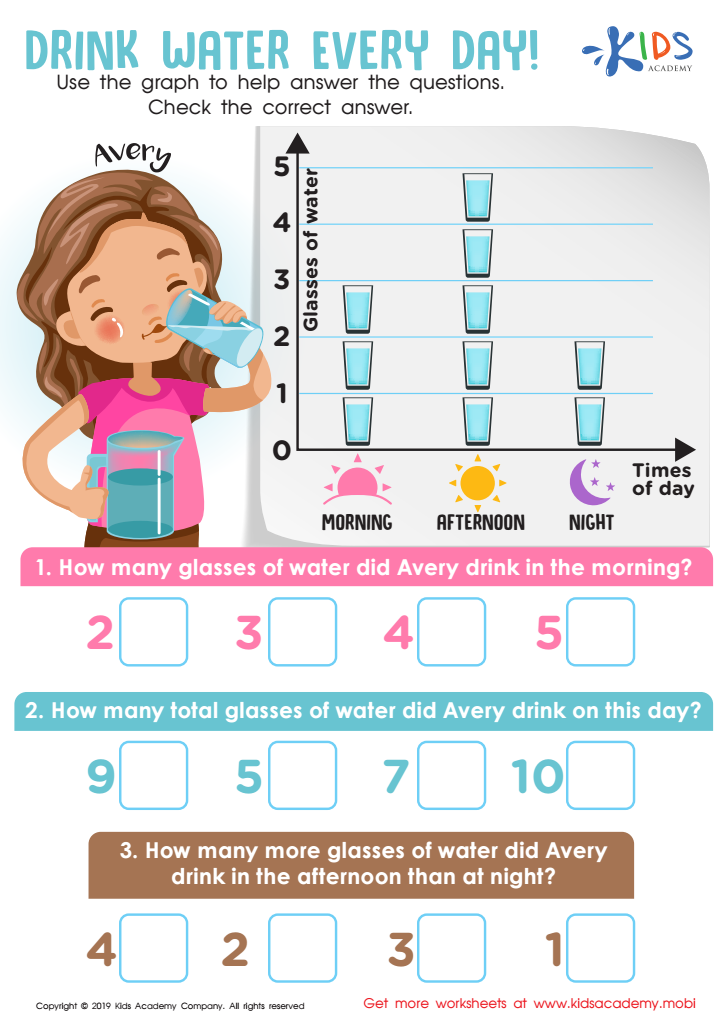
Drink Water Every Day! Worksheet
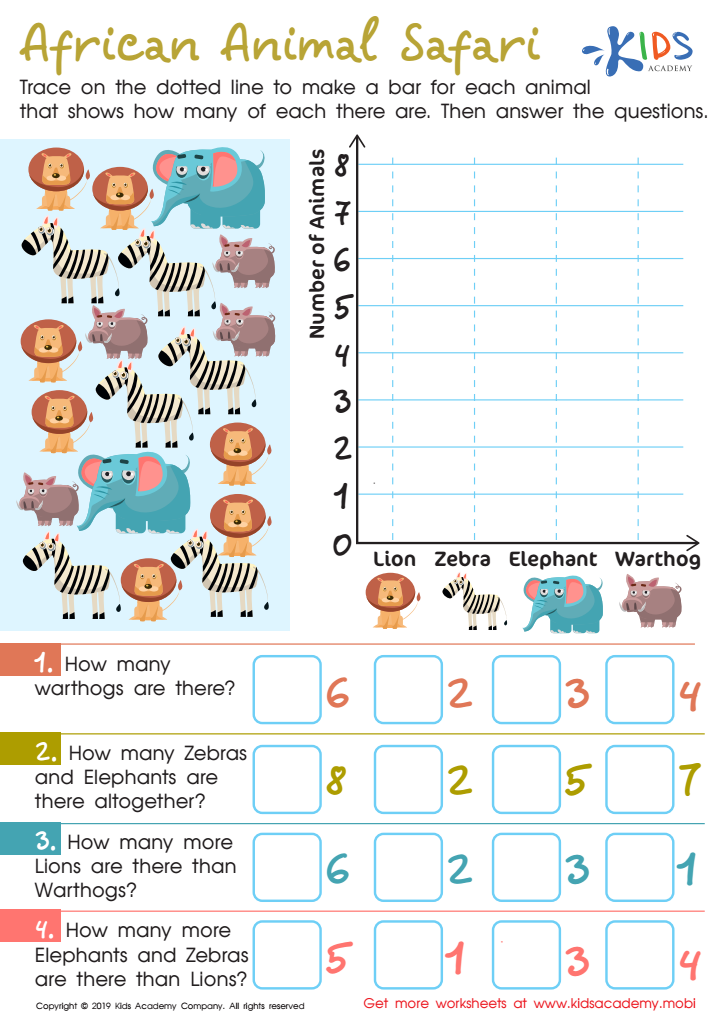
African Animal Safari Worksheet

Football Math Worksheet


Graphs for 7-Year-Olds might sound like a grown-up topic, but they're actually super fun and incredibly useful! When kids start exploring graphs through worksheets, they're embarking on an exciting adventure where numbers, pictures, and information come together in a way that’s easy to understand and visually appealing.
Why are these worksheets so great for young learners? First off, they make learning visible. Instead of just hearing or reading about numbers and data, kids get to see them in action. This visual representation helps solidify understanding and makes complex concepts simpler.
Secondly, worksheets on graphs introduce 7-year-olds to important skills they'll use throughout their education and life. They learn how to compare quantities, identify trends, and even make predictions. It's like giving them a toolkit for problem-solving and critical thinking at a very young age.
Also, let's not forget about the fun factor! Graphs for 7-year-olds are designed to be engaging. These worksheets often include colorful images, interesting themes, and interactive elements that turn learning into an adventure.
By working on graph worksheets, kids not only grasp fundamental math concepts but also gain confidence in their ability to interpret information. This early boost sets the stage for a lifetime of curiosity and learning. So, let the graph adventures begin!