Introduction to Line Plots - Lesson for Grade 2, Chapter - Keeping Track of Data
In the "Introduction to Line Plots" lesson, designed for Grade 2 students as part of the "Keeping Track of Data" chapter within the "Foundations and Applications in Measuring, Time and Data" unit, students embark on a fundamental journey to understand and use line plots. This lesson is crucial for young learners as it lays the groundwork for data interpretation and representation, skills that are pivotal in mathematics and daily life decision-making processes.
Through engaging activities such as "What Is a Line Plot? " and its accompanying worksheet, students will grasp the basic concept of line plots as a method of displaying data. The "Making a Correct Number Line: Balcony Garden Worksheet" and "Drawing a Line Plot: Mary's Teddy Bears Worksheet" extend this understanding by teaching students how to accurately create a number line and then use it to display data about real-world scenarios. The culminating activity, "Students Line Plot Worksheet," provides a hands-on opportunity for students to compile and present their data using line plots.
Learning to interpret and create line plots is essential for young students as it enhances their ability to organize, compare, and contrast quantitative information.
-
Activity 1 / What Is a Line Plot?
-
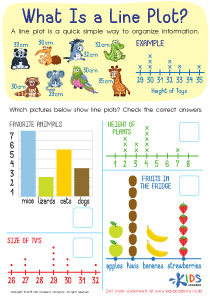
Activity 2 / What Is a Line Plot? Worksheet

A line plot is a simple and quick way to organize information. For example, if your child was given a task to do, and the task required organizing different objects for easy identification, a line plot would be the most ideal thing to draw up. So, this is a skill your child ought to learn. Use this simple worksheet to teach them how to draw up a line sheet. In the exercise, your little ones must check the correct pictures that show line plots.
-
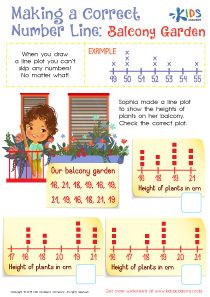
Activity 3 / Making a Correct Number Line: Balcony Garden Worksheet
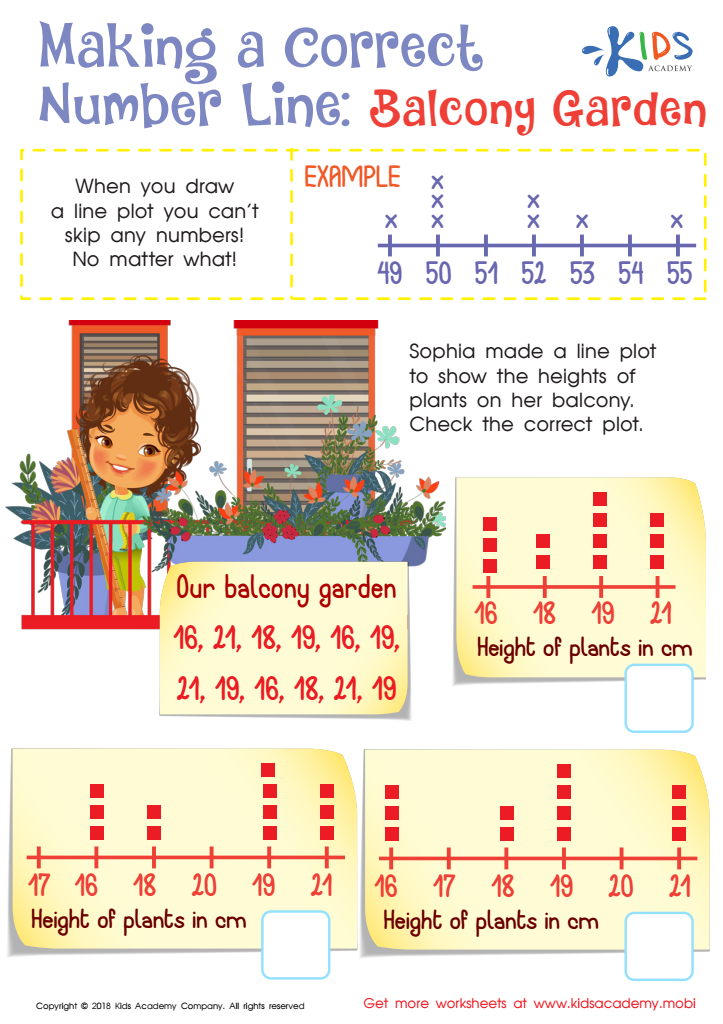
A line plot is a simple and quick way to organize information, and your child will need this skill to properly organize objects. Teaching your child how to properly draw and identify a line plot is essential, and you can use this worksheet to do just that. When you draw a line plot, you must remember that you can never skip any numbers. In this exercise, Sophia made a line plot to show the heights of plants in her balcony. Ask your child to help Sophia check the correct plot.
-
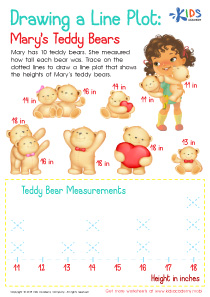
Activity 4 / Drawing and Line Plot: Mary's Teddy Bears Worksheet

A line plot is a simple and quick way to organize information, and your child will need this skill to properly organize objects. This worksheet will teach your little ones how to properly draw and identify a line plot. In this exercise, Mary has 10 teddy bears, and she has measured how tall each one is. Now, ask your child to trace on the dotted lines to draw a line plot that correctly shows the heights of Mary’s teddy bears.
-
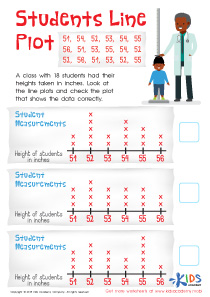
Activity 5 / Students Line Plot Worksheet

In order for your students to learn how to draw a proper line plot, you must give them real practicable examples, such as the one given in this worksheet. In this exercise, your students will be asked to check the plot that shows a data correctly. The data is: A class with 18 students had their heights taken in inches. Look at the line plots and check the plot that shows the data correctly. Help your students figure out which of the line plots is correct.