Easy Graphs Worksheets for Ages 6-9
6 filtered results
Difficulty Level
Grade
Age
-
From - To
Subject
Activity
Standards
Favorites
With answer key
Interactive
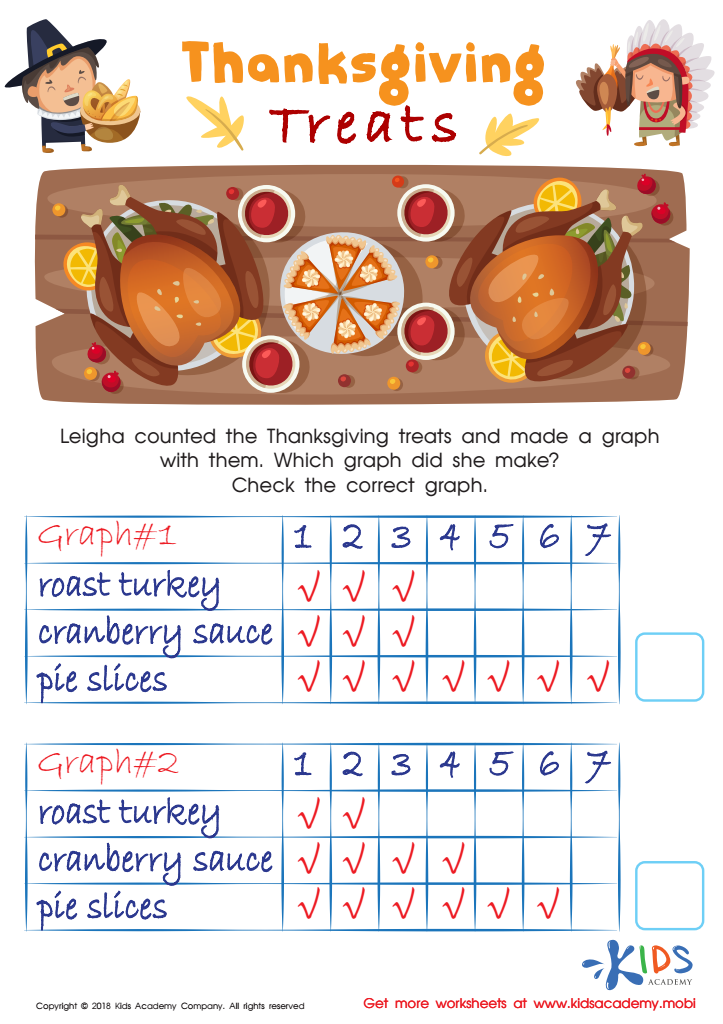
Graphs: Thanksgiving Treats Worksheet
Enjoy Thanksgiving treats with this fun PDF worksheet! Kids will count the treats and choose which graph accurately shows the number of each item. From turkey to cranberry sauce to pie slices, children will develop visual discrimination and graphing skills while assigning value to pictures.
Graphs: Thanksgiving Treats Worksheet
Worksheet

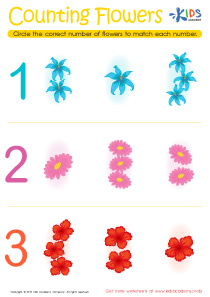
Fruit Math: Picture Graphs Worksheet
Help your child learn to draw graphs by having them look at pictures. Ask them to identify a graph that accurately portrays the data and have them explain why. This will prepare them to easily draw more complex graphs in the future. For example, have them look at the picture with the number of fruits in the colorful worksheet and explain why the graph is accurate.
Fruit Math: Picture Graphs Worksheet
Worksheet
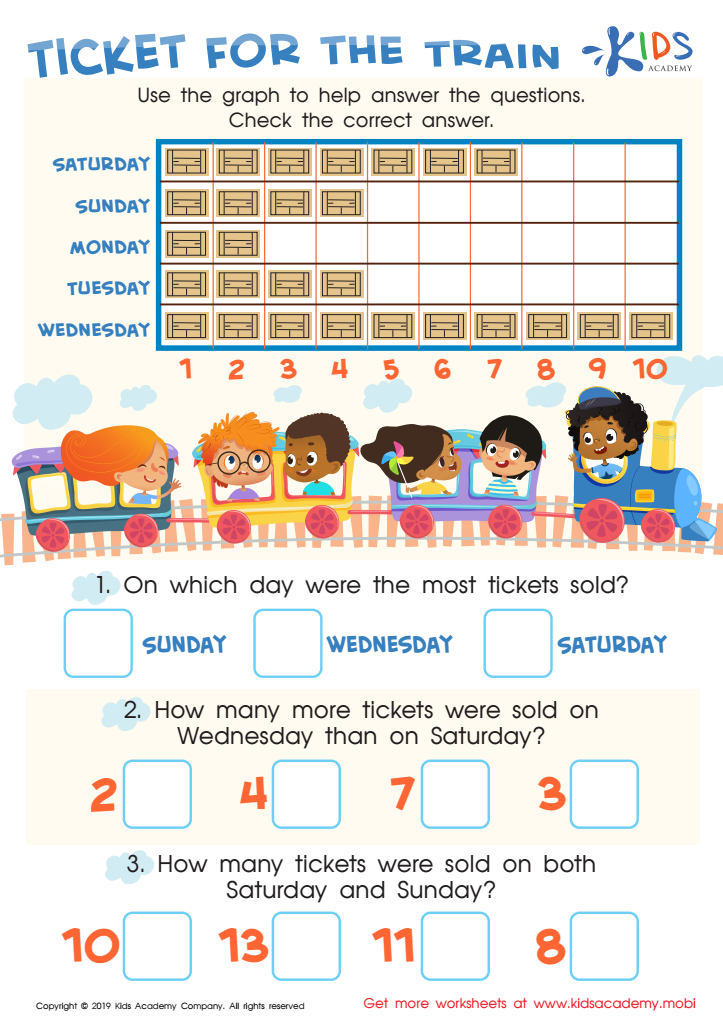
Ticket for the Train Worksheet
It's important to use fun scenarios with familiar objects when teaching kids. Try discussing train rides and the accompanying picture graph. Ask questions about it, then help kids check the correct answers. Let them enjoy the learning process!
Ticket for the Train Worksheet
Worksheet
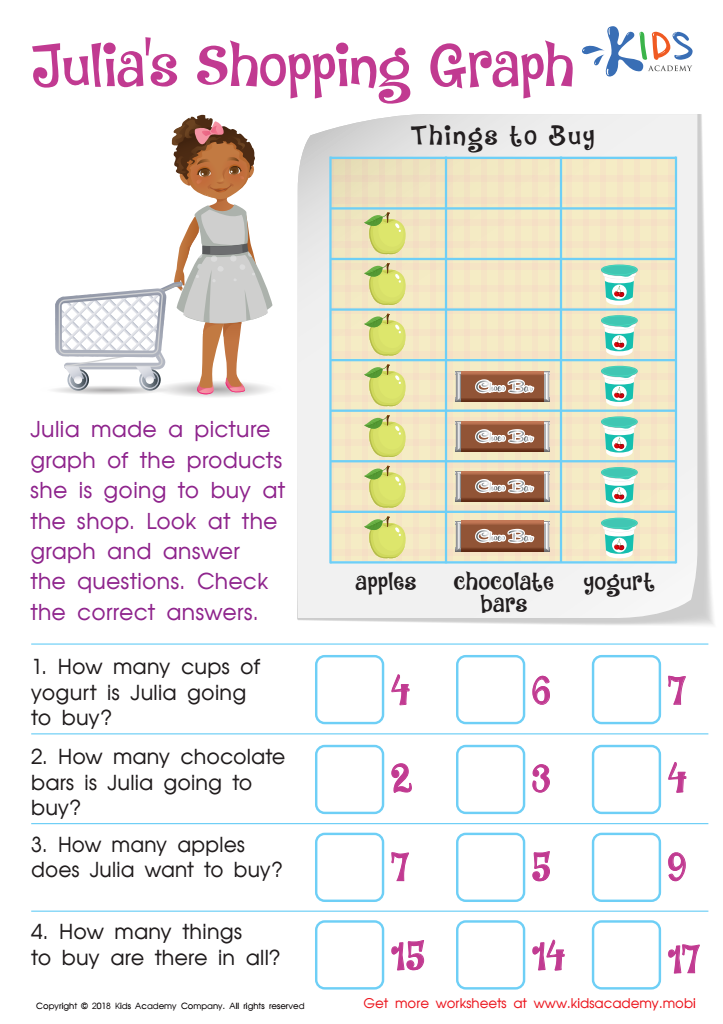
Julia's Shopping Graph Worksheet
This fun PDF worksheet provides little mathematicians with practice using pictographs. They will answer questions about Julia's graph, helping to assess their understanding of reading and interpreting data. Counting and choosing the correct answer is sure to be an enjoyable experience!
Julia's Shopping Graph Worksheet
Worksheet

Egyptian Bar Graph Worksheet
Help your kids get a hang of bar graphs with this fun worksheet. Examine the picture of the ancient pyramids and help them match the bar graph to it. Check the box next to the correct bar graph and watch your little ones learn quickly!
Egyptian Bar Graph Worksheet
Worksheet

Aircraft Carrier Picture Graphs Worksheet
Kids love learning about jets and boats with this awesome worksheet! It's a great way to engage them as they work on picture graphs. Representing numerical values with pictures, this free PDF requires them to choose which picture graph and representation best match the carrier in the picture. It's also great practice for visual discrimination!
Aircraft Carrier Picture Graphs Worksheet
Worksheet