Data analysis Extra Challenge Grade 3 Graphs Worksheets
2 filtered results
Difficulty Level
Grade
Age
-
From - To
Subject
Activity
Standards
Favorites
With answer key
Interactive
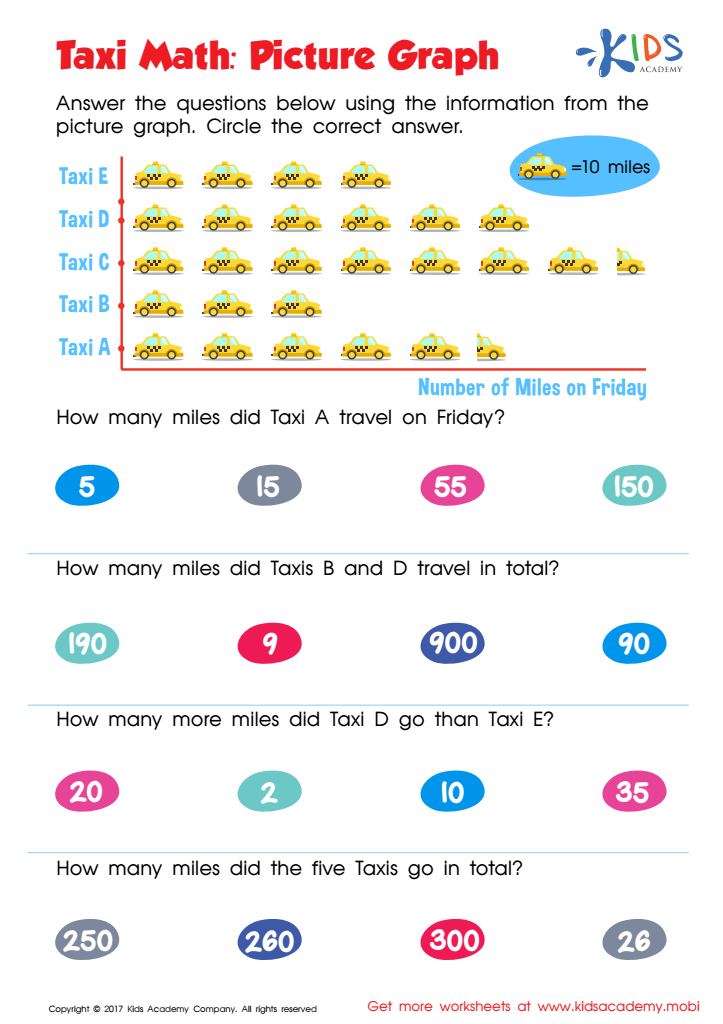

Taxi Math Worksheet
This 3rd grade worksheet helps kids learn data viz with fun taxis and colors to make the graph come alive. Picture graphs are an engaging way to teach data analysis, and this worksheet is the perfect tool!
Kids love picture graphs! This 3rd grade worksheet uses colorful taxis to help them learn to read graphs better. Each image represents a number, teaching data analysis with visuals and fun. An engaging way to learn data viz, this worksheet is perfect for young learners.
Taxi Math Worksheet
Worksheet
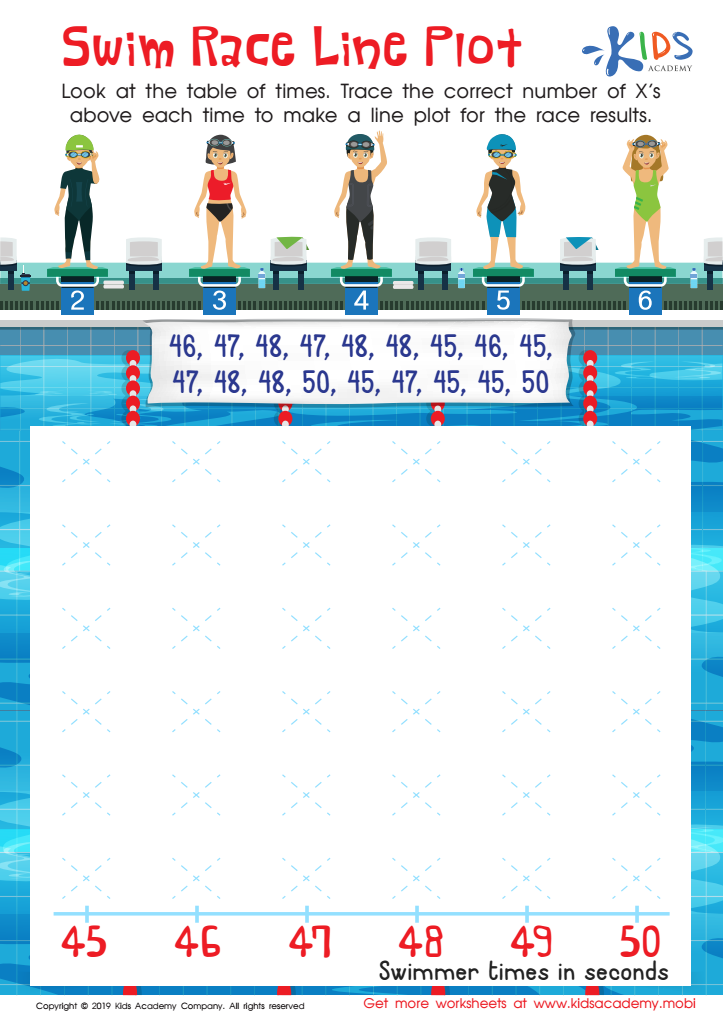

Swim Race Line Plot Worksheet
Kindergartners can benefit from extra help with math, particularly line plots. This worksheet can make the concept easier to understand. Together, study the table of times; then, guide the kids in tracing the correct number of x's above each time to make a line plot for the race result.
Swim Race Line Plot Worksheet
Worksheet
 Assign to My Students


