Analyzing charts Worksheets for Kids
1 filtered results
-
From - To
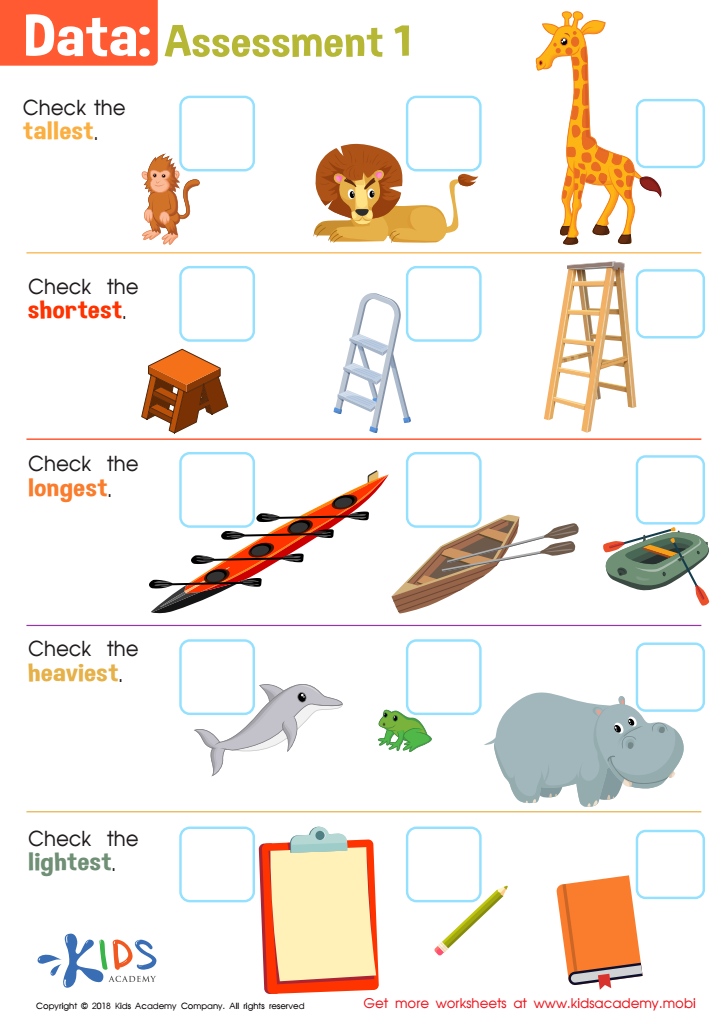
Data: Assessment 1 Worksheet
Question/Answer
How does the mastery of the Analyzing charts skill affect a student's performance at an early age?
Mastery of analyzing charts at an early age significantly enhances a student's performance by improving their data literacy, critical thinking, and problem-solving skills. It enables them to interpret and make informed decisions based on visual data representations, fostering a deeper understanding of mathematical concepts and real-world applications.
How to test a Kindergarten student’s Analyzing charts skills?
To test a Kindergarten student's analyzing chart skills, provide simple, colorful charts with basic shapes, animals, or familiar objects. Ask the student to count and compare quantities, identify which category has more or less, and explain their findings. Keep questions straightforward and visual, ensuring the chart is engaging and relevant to their everyday experiences.
How to train the Analyzing charts skill in Kindergarten students learning about Measurement?
Introduce kindergarten students to basic chart analysis by incorporating simple, colorful pictorial charts or bar graphs that represent familiar items or concepts (e. g. , types of fruits, pets, or favorite colors). Engage them in counting and comparing the quantities, discussing which has more or less, and asking questions to interpret the data visually.