Data interpretation Normal Worksheets for Ages 8-9
4 filtered results
-
From - To
Explore our engaging Data Interpretation Normal Worksheets designed specifically for kids aged 8-9! These worksheets encourage critical thinking and analytical skills by introducing essential concepts such as charts, graphs, and tables. Each activity is crafted to help young learners understand how to collect, organize, and interpret data in a fun and interactive way. With a range of topics, children will develop confidence in making decisions based on factual information. Perfect for at-home learning or classroom use, our worksheets promote essential math and reading skills while making data interpretation accessible and enjoyable. Unlock your child’s potential today!
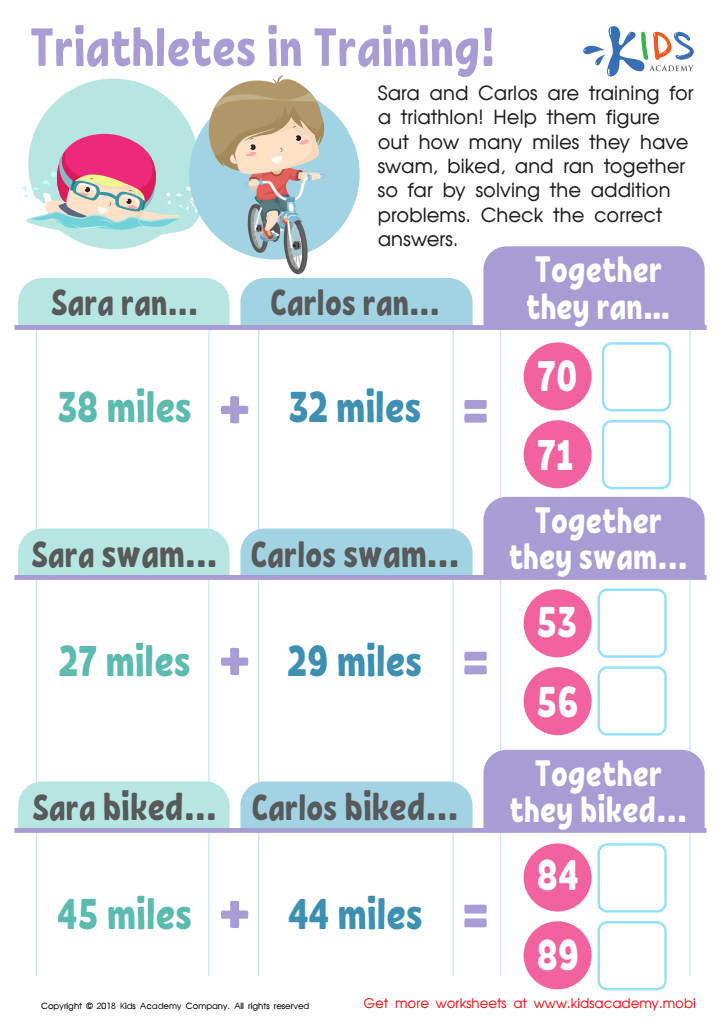

Triathletes in Training Worksheet
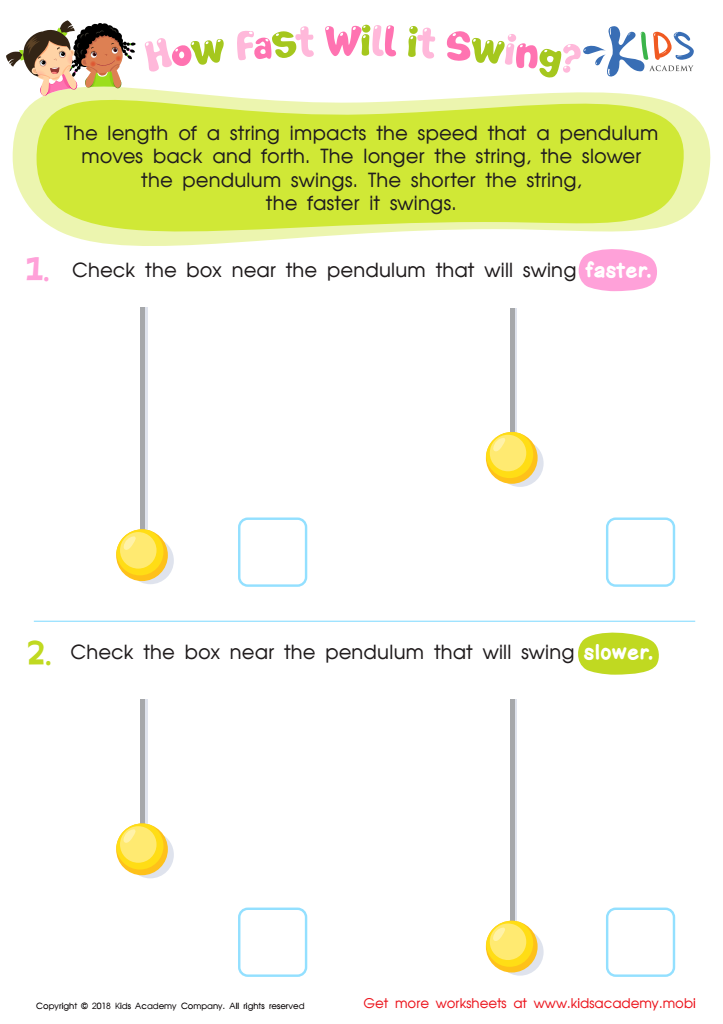

Pendulum Experiment Worksheet For 3rd Grade
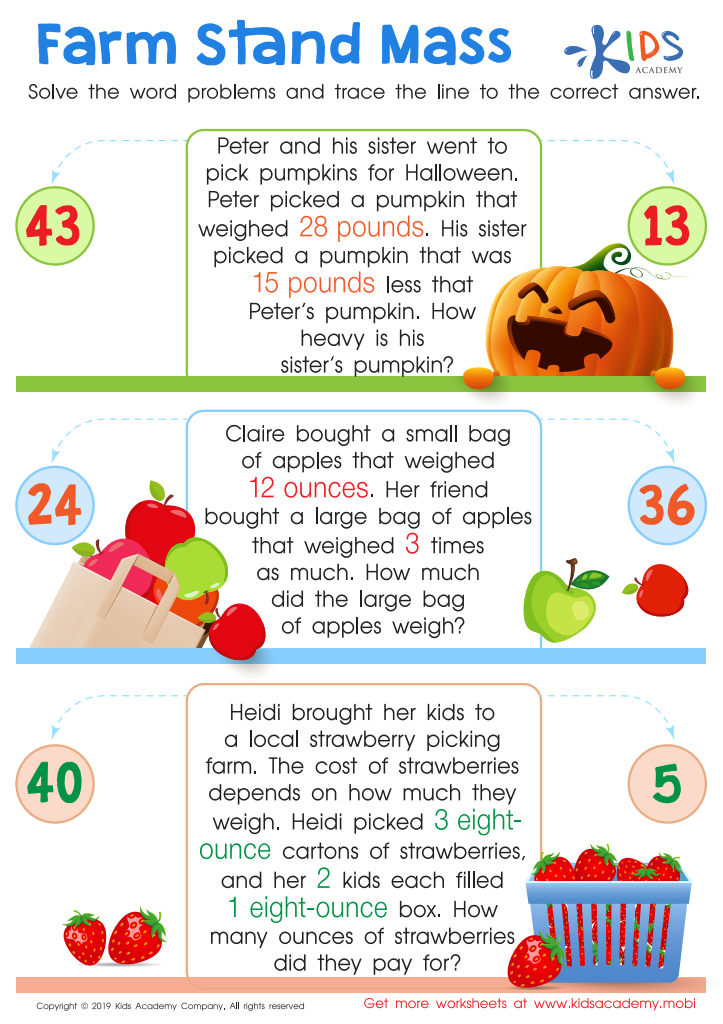

Farm Stand Mass Worksheet
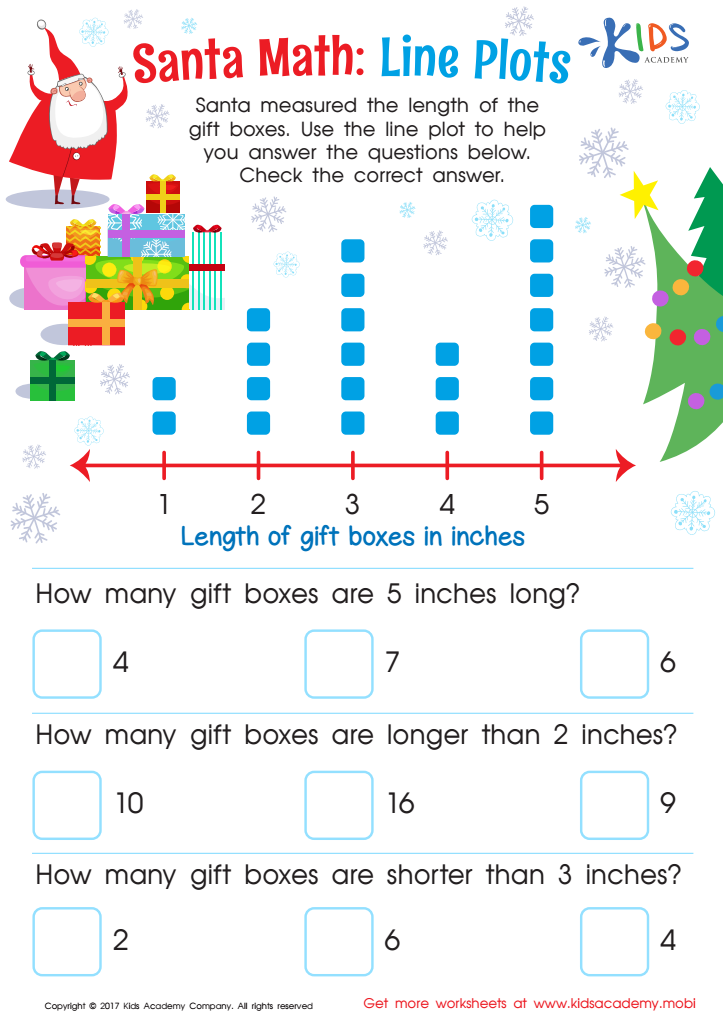

Line Plot Worksheet
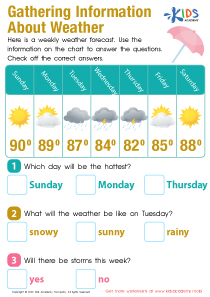
Understanding data interpretation is vital for children ages 8-9, as it lays a foundation for critical thinking and decision-making skills. At this age, students begin to engage with basic statistical concepts, such as graphs, charts, and simple data sets. Parents and teachers should prioritize this skill because it enables children to make sense of the information they encounter daily, from reading a weather chart to analyzing survey results in class.
Moreover, data interpretation helps enhance numeracy skills, fostering a student’s ability to recognize patterns, compare information, and make predictions. These foundational skills not only boost children's confidence in math but also prepare them for more advanced quantitative analysis as they progress in their education.
In a world increasingly driven by data, the ability to interpret information accurately is essential for informed decision-making across various life contexts, from academic settings to future career paths. Additionally, cultivating early data literacy promotes curiosity and empowers children to ask questions and seek answers, essential components of a lifelong love of learning. Therefore, parents and teachers should actively engage students in fun, hands-on activities related to data interpretation, reinforcing its importance and practical applications in their lives.
 Assign to My Students


