Data Analysis in Elementary School: Major Milestones
May 5, 2025
Data analysis is not something only researches do. Actually, students as young as first grade are already supposed to be able to collect and make sense of numeric data. Elementary school data analysis skills constitute a critical component of both math and science classes in the early grades.
In fact, preschoolers begin laying the foundation for future data analysis skills when they learn to sort and match objects or when teachers help them to keep track of the daily weather. Even so, data analysis doesn’t begin in earnest until the grade 1 when they are introduced to simple graphs.
Let’s explore the major milestones that children must learn to master this critical skill. From tally charts to bar graphs, Kids Academy offers worksheets for every grade level and milestone along the way.
Grades 1-2
In kindergarten and preschool, children practice matching and sorting to build their number sense and counting skills. This is vital for learning to collect and work with datasets, which is the initial step that first graders must learn to begin analyzing data.
When finding resources to use to help students develop these initial skills, look for materials that have short simple instructions, rely mainly on visuals, and feature graphs and problems that are relevant to children’s everyday lives.
Some of the major concepts that students cover at this grade level include:
Collect, Sort, and Analyze data
First graders should have mastered simple counting, including counting groups of objects and can now gather data by counting objects and representing them using T-charts and tally marks.
click on the online worksheet to open it
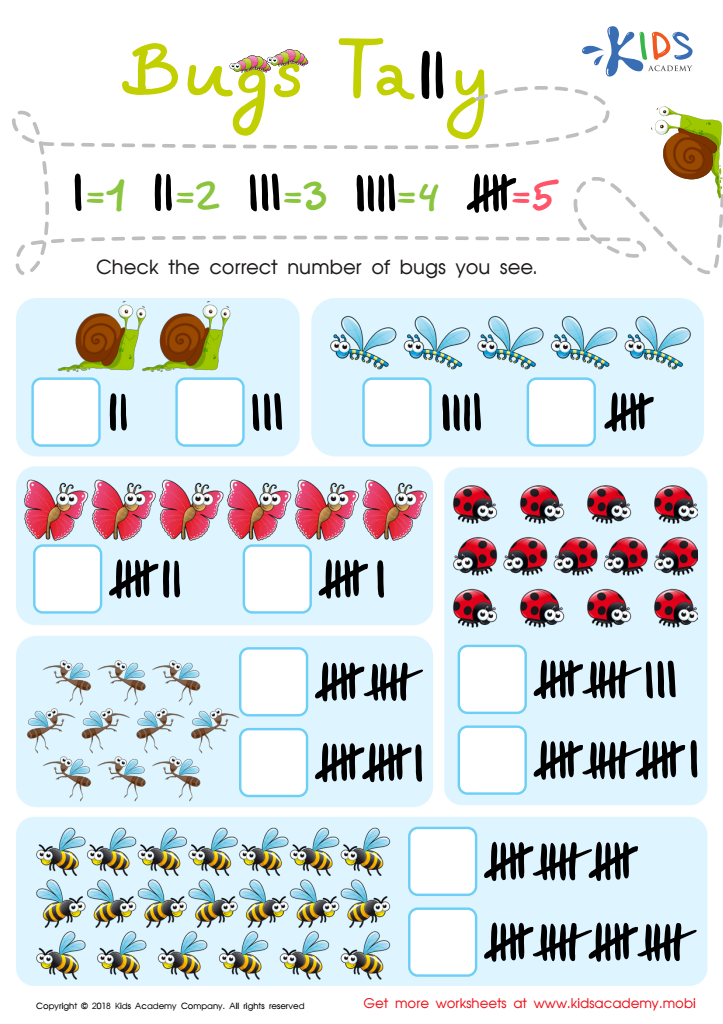
When first starting out, students must learn to associate an object with a tally mark. For example, on the Bugs Tally worksheet above, kids practice using tally marks to represent each bug picture depicted in each dataset.
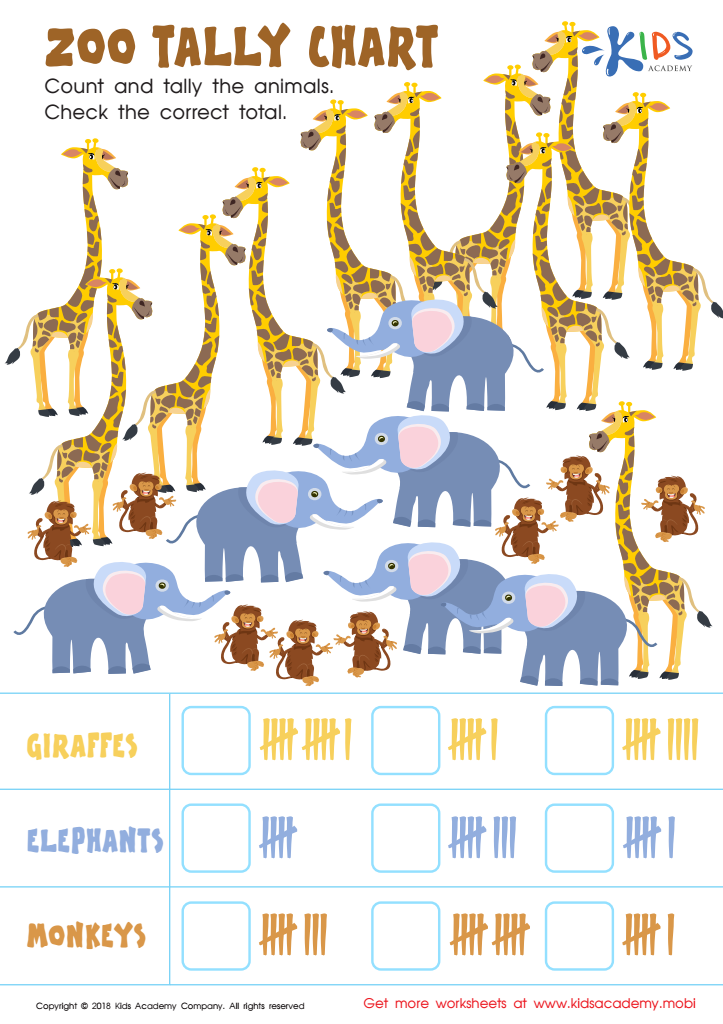
Once they learn that the marks represent an object, they also must learn how to count them, which can be a bit tricky due to the way tally marks are written, with the fifth as a slash through a set of four. In the Zoo Tally Chart worksheet, children practice counting and organizing tally totals.
Create Picture and Bar Graphs and Answer Questions
Students should be introduced to a variety of graphs during grade 1, including simple picture and bar graphs.
click on the online worksheet to open it
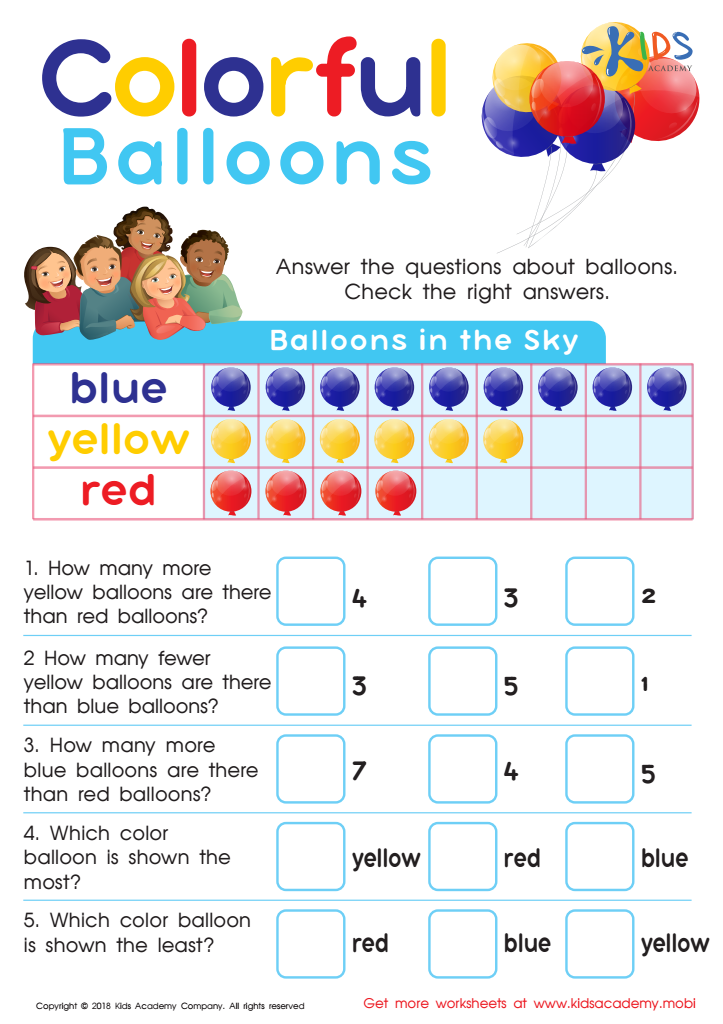
The Colorful Balloons worksheet is a great example of a picture graph that also helps children to begin understanding how bar graphs work. 1st graders can easily count the balloons to find how many of each color are in the graph, and because the balloons are grouped in rows, they start to look like bars on a graph. This visual helps to train the eyes to look for rows of objects to begin comparing quantities.
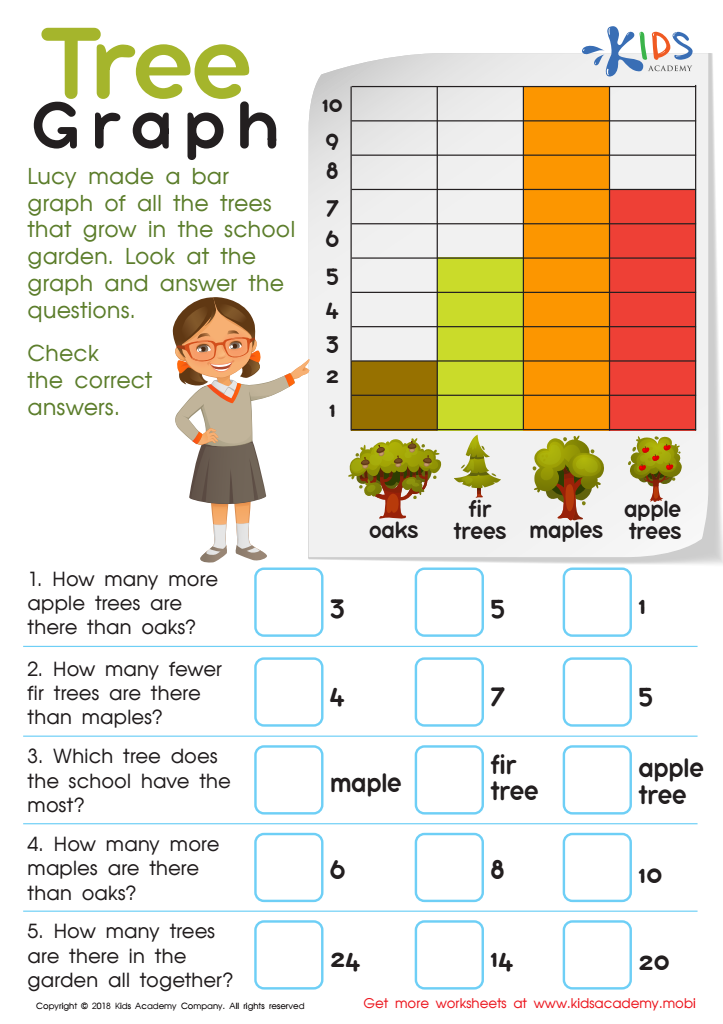
The Tree Graph worksheet introduces a real bar graph to kids, while still providing pictures to help forge a connection between the objects and what the bars represent.
Learn to Interpret Bar Graphs and Line Plots
In 2nd grade, students work with more advanced graphs to practice and strengthen their data analysis skills, including various picture graphs, line plots, and bar graphs. Even so, each graph should be driven by colorful graphs that highlight data topics that students can easily relate to and care about.
click on the online lesson to open it
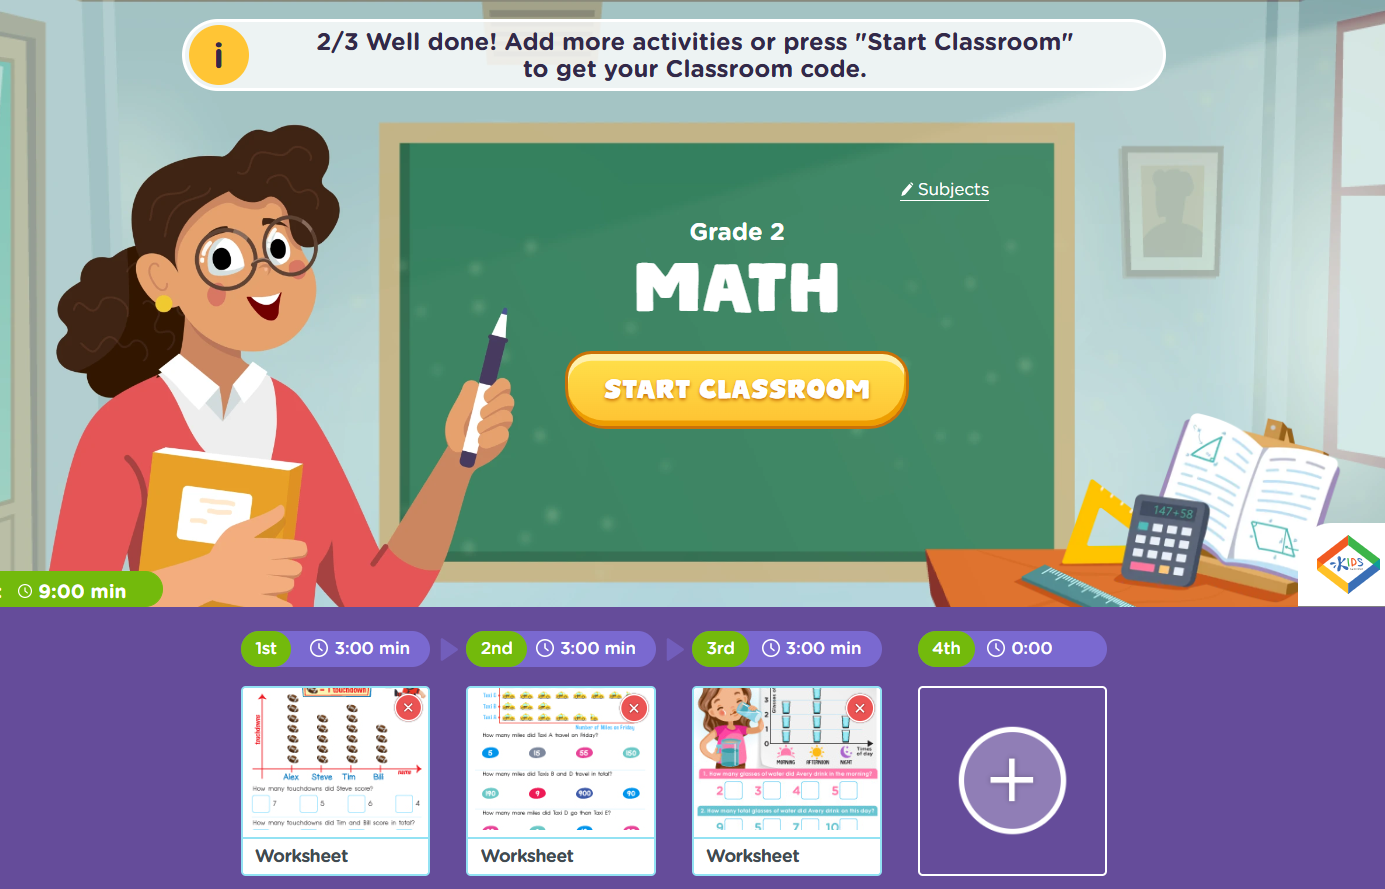
At this grade level, children must learn to interpret data that is presented in a variety of complex ways. The Line Plot lesson and the Picture Graphs lesson linked above introduce 2nd graders to the essential types of graphs, offering them ample practice for building confidence and competency in working with data.
Grades 3-4
As children grow, so do their skills! 3rd and 4th graders continue to build upon the skills they learned in previous grades by interpreting various types of complex graphs, only this time they begin using them to solve multistep and word problems. For older elementary children, it’s imperative that they have hands-on opportunities for learning so they can better understand the different ways that data can be collected and analyzed. For example, let students create their own survey or collect data that stems from their class activities, school day, or experiments.
Some specific topics to focus on include:
Using Graphs to Solve One-step Word Problems
click on the online lesson to open it
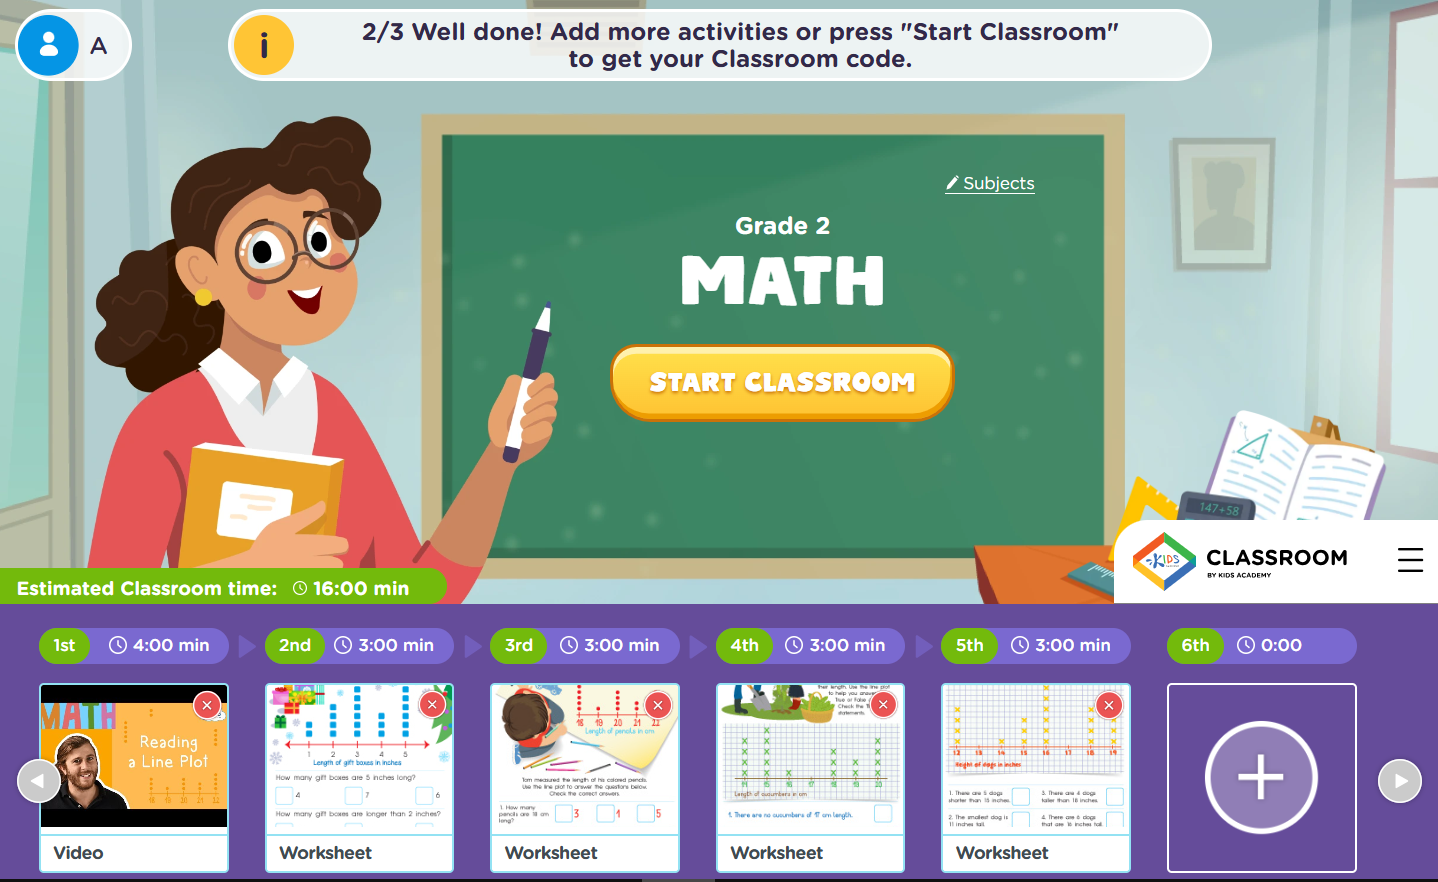
Before moving on to complex word problems, students must practice one-step problems. In the lesson linked above, students practice reading bar graphs in multiple ways, including matching quantities, creating the graphs by filling in the bars, and interpreting them.
Using Graphs to Solve Multistep Word Problems
click on the online lesson to open it
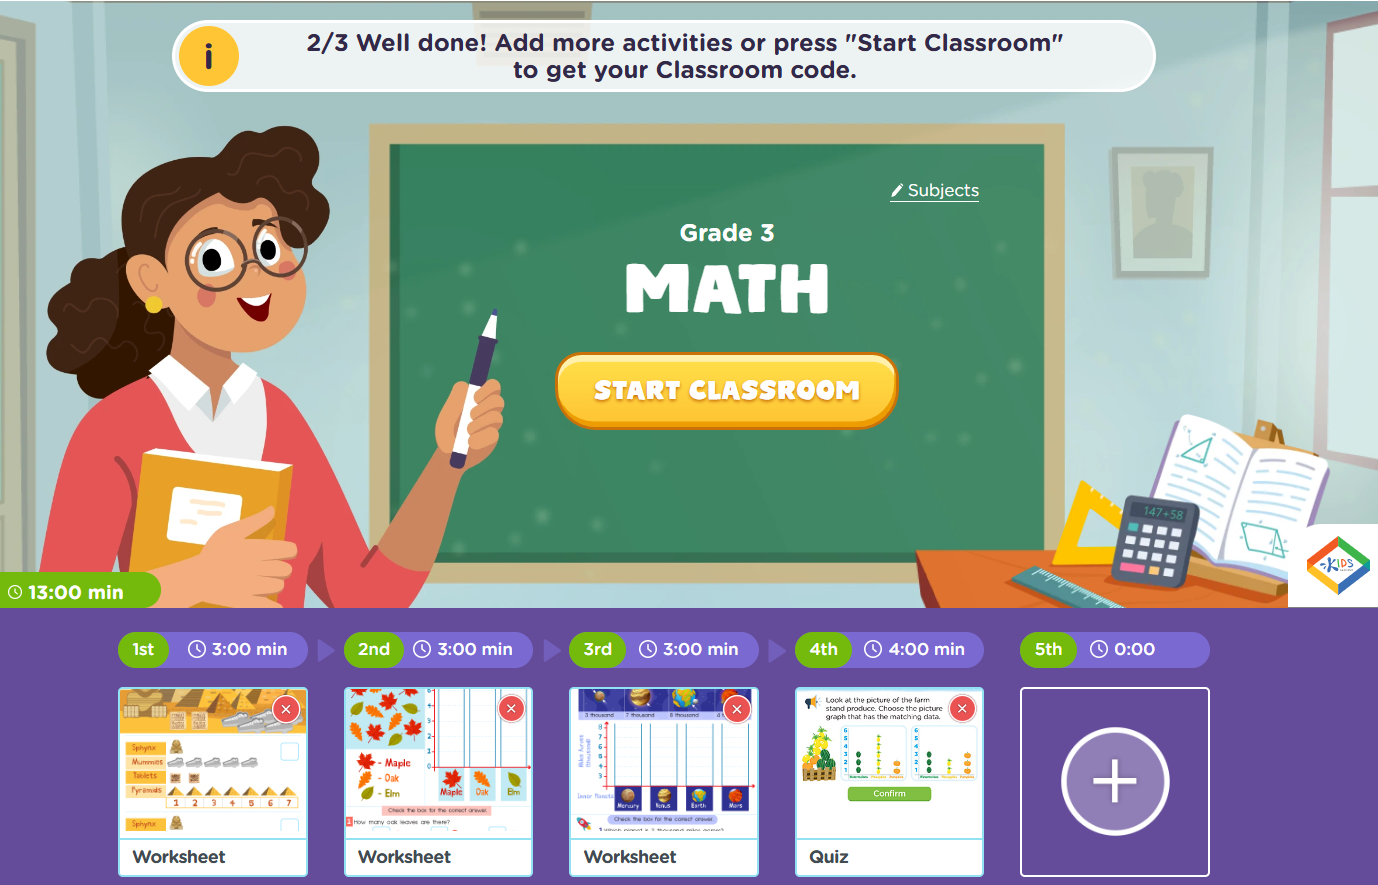
Eventually students progress to solving multi-step word problems by interpreting graphs. Not only must students be able to read the graphs and extract the data from them also to manipulate that data by making several addition and/or subtraction operations in order to solve complex problems.
Data analysis is an integral skill for children to master in both math and science subject areas. With enough practice, elementary students learn to represent, read, and interpret numerical information quickly to solve problems. Kids Academy offers a wide selection of online worksheets, videos, and entire lessons that will assist your little learners in their quest to analyze data!