Visual Learning Math Worksheets for Ages 3-8 - Page 2
101 filtered results
Difficulty Level
Grade
Age
-
From - To
Subject
Activity
Standards
Favorites
With answer key
Interactive

Taxi Math Worksheet
This 3rd grade worksheet helps kids learn data viz with fun taxis and colors to make the graph come alive. Picture graphs are an engaging way to teach data analysis, and this worksheet is the perfect tool!
Kids love picture graphs! This 3rd grade worksheet uses colorful taxis to help them learn to read graphs better. Each image represents a number, teaching data analysis with visuals and fun. An engaging way to learn data viz, this worksheet is perfect for young learners.
Taxi Math Worksheet
Worksheet
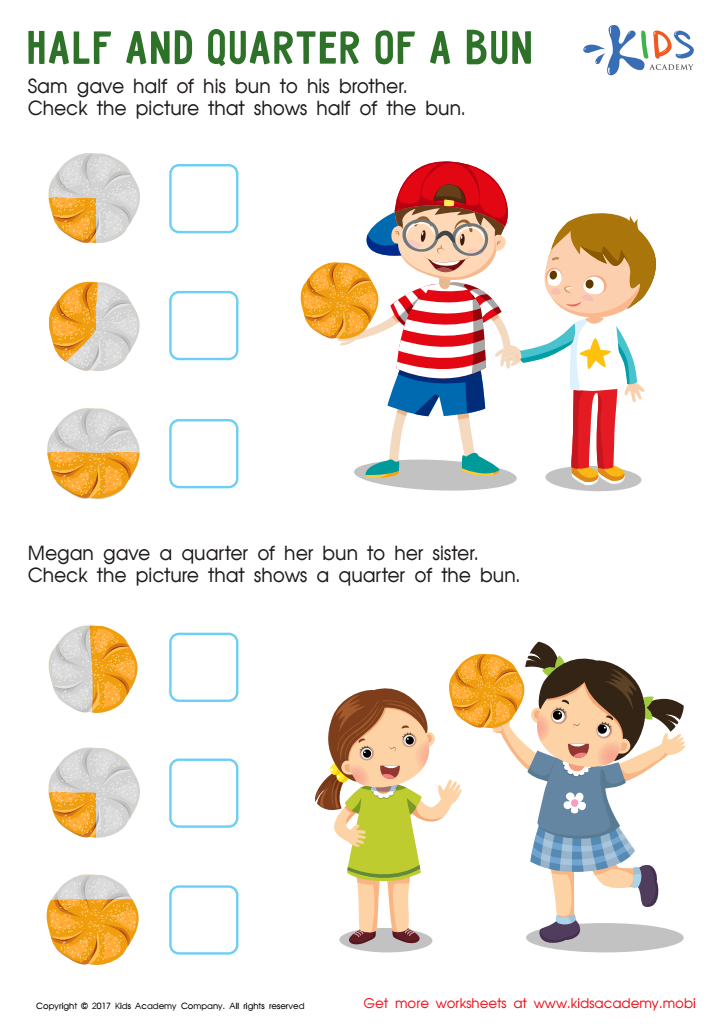
Half and Quarter of a Bun Worksheet
This worksheet introduces Sam, his brother and Megan, her sister, who are sharing buns. Show kids the picture of half and quarter to help them understand. Ask if they know what half and quarter of a shape is before progressing. Help them check the picture showing half and quarter of a bun.
Half and Quarter of a Bun Worksheet
Worksheet
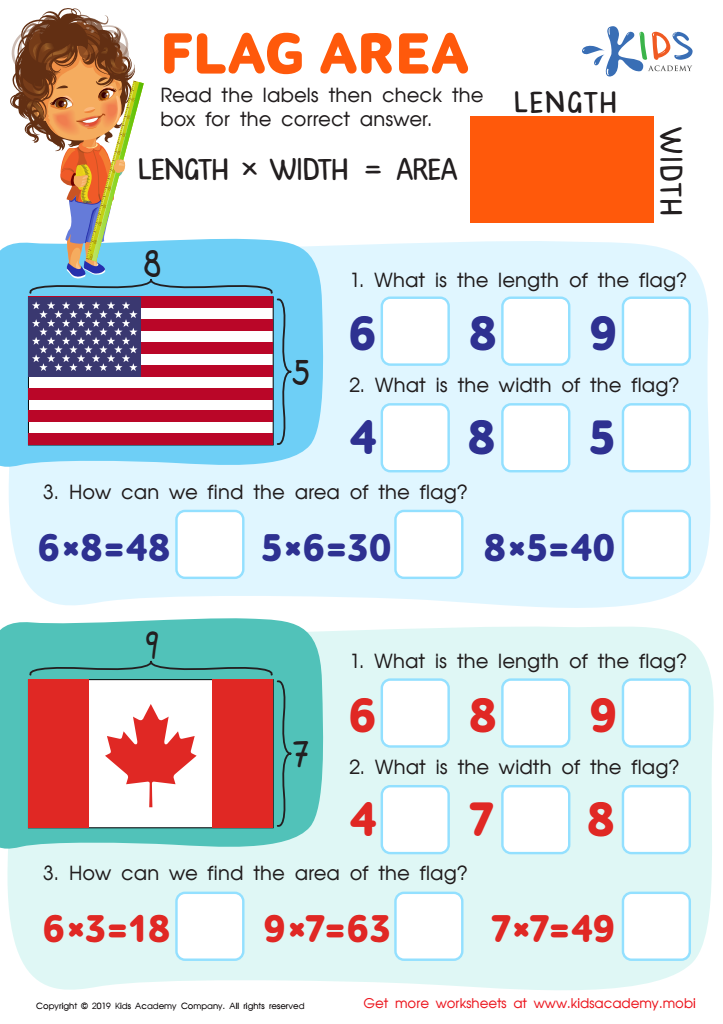
Flag Area Worksheet
Test your child's knowledge of flags by asking which ones they can identify in the image. Then, study the worksheet together. There are 6 questions with labels. Have them read each label and check the box for the correct answer.
Flag Area Worksheet
Worksheet
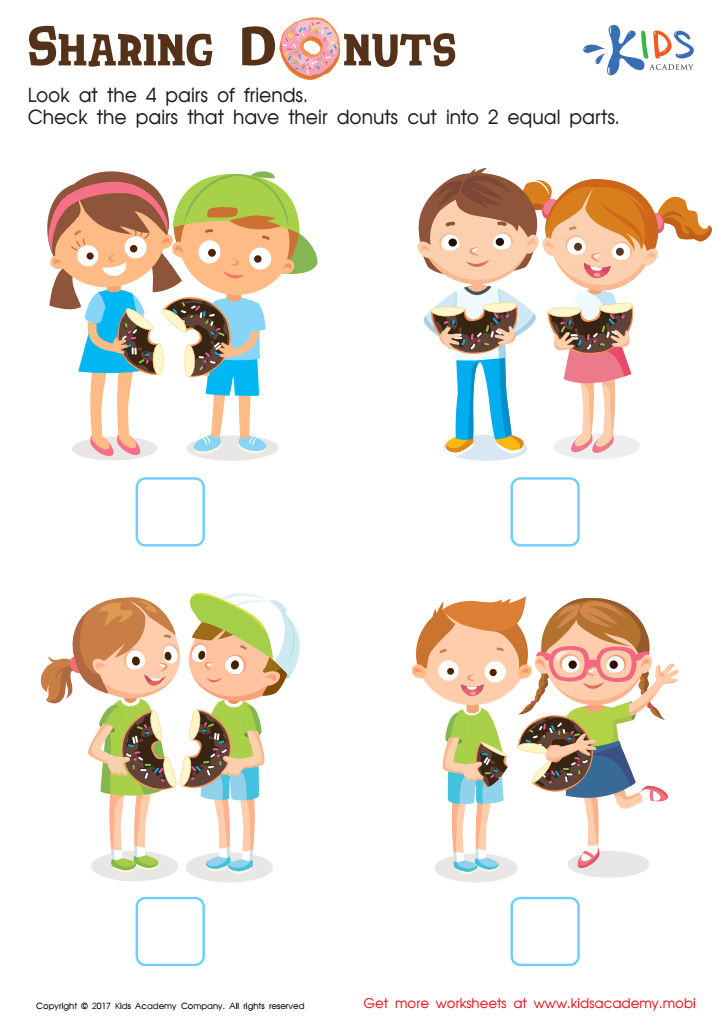
Sharing Donuts Worksheet
Get your kids to check which of the 4 pairs of friends in the worksheet have evenly-split donuts. No one likes being cheated out of a treat, so it's important to make sure the donuts are divided fairly. Plus, your kids will love the challenge!
Sharing Donuts Worksheet
Worksheet
.jpg)