Coffeehouse Survey: Picture Graph Word Problems Worksheet
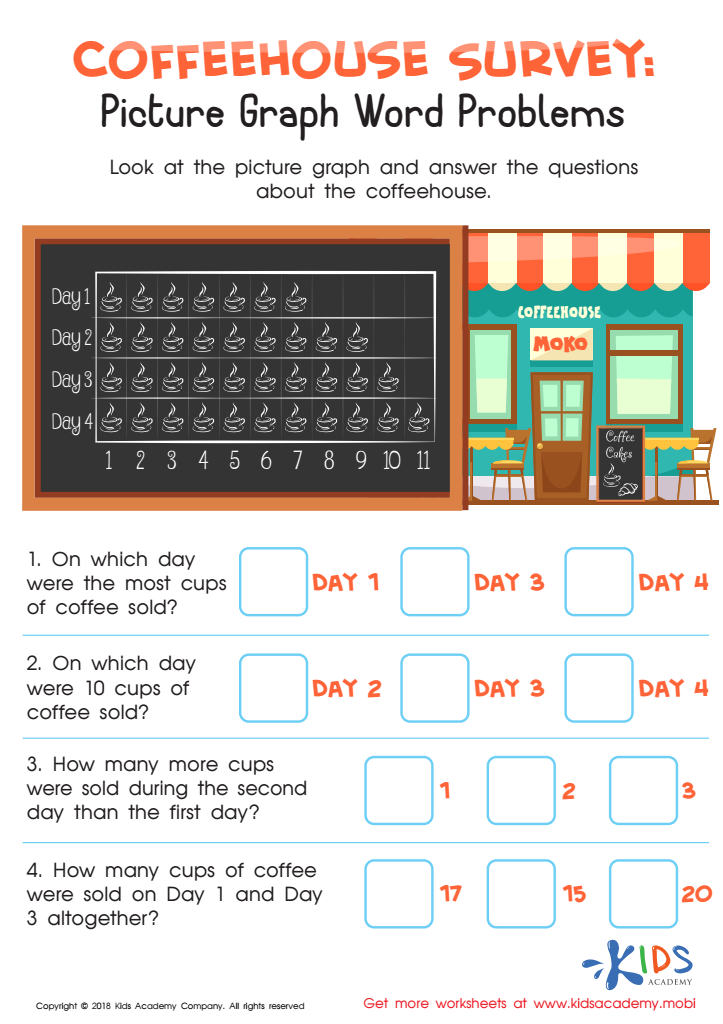
In this coffeehouse survey, your child will learn more about interpreting pictures into word sentences and using them to answer some questions. In the picture, there is a picture graph showing the number of coffee cups sold for each day, from Day 1 to Day 4. Look at this picture graph with your child and help them answer the questions about the coffeehouse. Questions your child will need to answer in this worksheet include questions on the number of coffee cups sold per day, and which day had the most sales.
Required skills:
To resolve this worksheet, students should know how to read and interpret picture graphs, convert visual information into word problems, and use addition and subtraction to compare the quantities represented in the graph. They also need to understand the concept of most and least.