Analyzing line plots Worksheets for Kids
1 filtered results
-
From - To
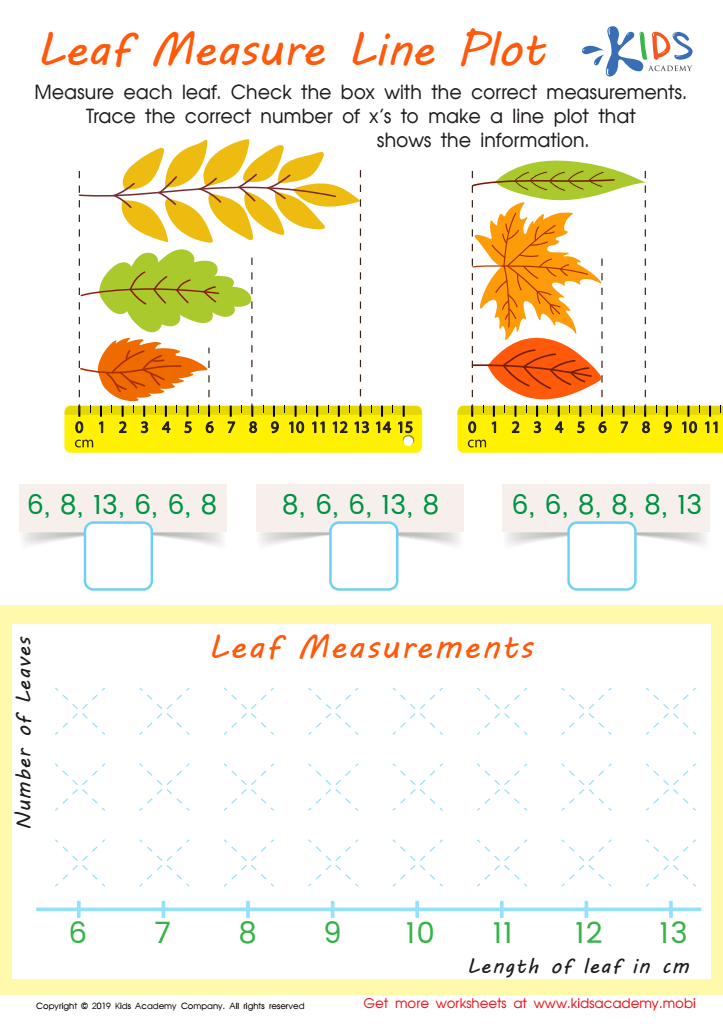

Leaf Measure Line Plot Worksheet
Question/Answer
How to train the Analyzing line plots skill in Grade 3 students learning about Addition & Subtraction?
To train Grade 3 students in analyzing line plots with a focus on Addition & Subtraction, introduce simple line plots using real-life contexts (e.g., temperatures, lengths). Have students create and label their own plots with collected data. Guide them through adding and subtracting values directly from the plots, and solving related word problems to apply their understanding in practical scenarios.
How to test a Grade 3 student’s Analyzing line plots skills?
To test a Grade 3 student's analyzing line plots skills, provide them with a line plot that includes several data points. Ask questions related to the data, such as identifying the range, finding the most or least frequent data points, determining the total number or sum of a specific data point, and interpreting the data to solve word problems.
What are some effective activities to train students’ Analyzing line plots skill when teaching them about Addition & Subtraction?
To train students in analyzing line plots for Addition & Subtraction, incorporate activities like creating their own line plots with collected class data (e. g. , heights, shoe sizes), solving problems that involve adding or subtracting quantities represented on these plots, and using line plots to compare data sets.
 Assign to the classroom


