Generate Line Plots by Measuring Objects - Lesson for Grade 2, Chapter - Keeping Track of Data
In the "Generate Line Plots by Measuring Objects" lesson, designed for second-grade students, learners will delve into the practical and engaging world of data collection and representation. This lesson is a pivotal part of the "Foundations and Applications in Measuring, Time, and Data" unit, located within the chapter on "Keeping Track of Data." Through a series of carefully curated activities — including the Aircraft Line Plot, Kids Measurements Worksheet, Family Line Plot Worksheet, and Pencil Case Line Plot Worksheet — students will gain hands-on experience in measuring various objects and representing their findings using line plots.
By participating in these activities, students will learn how to accurately measure objects using standard units of measurement, understand the concept of data representation through line plots, and analyze the data they have collected. This skill set is crucial for young learners as it lays the groundwork for understanding more complex math concepts in the future. Moreover, the ability to gather, represent, and interpret data is not only essential for academic success but is also a valuable skill in everyday life. Engaging in these interactive activities, students will foster a deeper appreciation for mathematics and its practical applications in the real world.

-
Activity 1 / Aircraft Line Plot
-
Activity 2 / Kids Measurements Worksheet
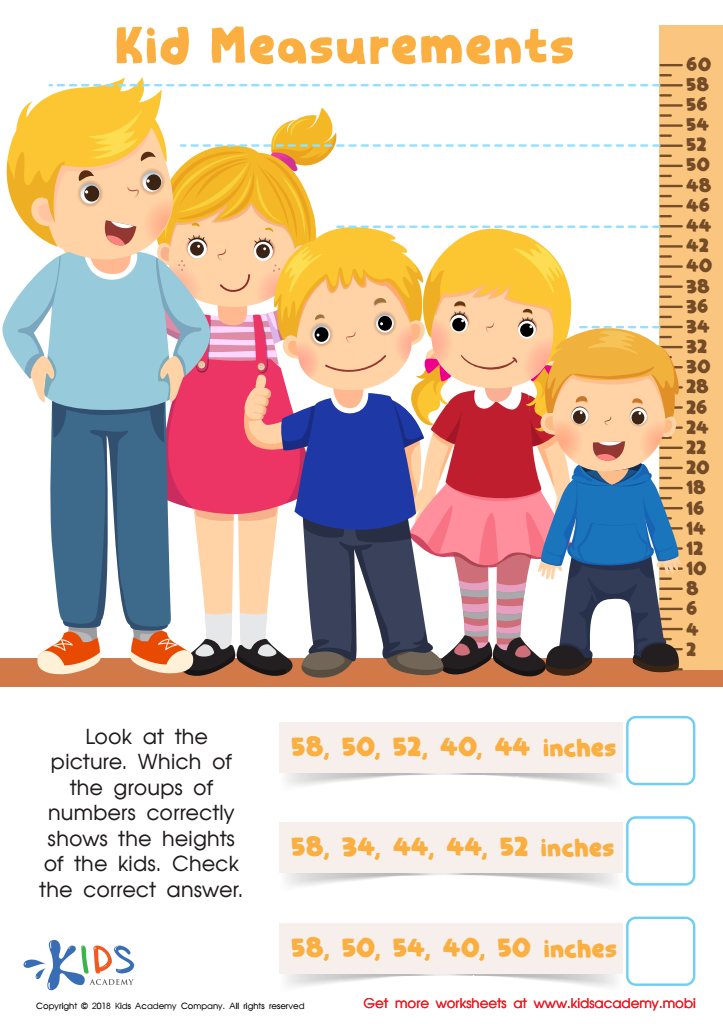
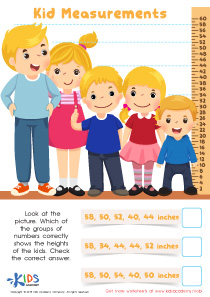
This worksheet shows a picture of some kids who have been arranged in order of height. To the right of the kids is a ruler, and each kid’s height is traced to a measurement on the ruler. What your kids must do is look at the groupings on the bottom right of the page, and check which of the groups of numbers correctly shows the heights of the kids. Help your little ones check the correct answer.
-
Activity 3 / Family Line Plot Worksheet

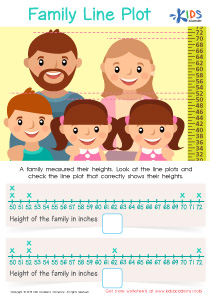
Have you and your kids ever done a family height measurement? How did it go? Did your kids understand and enjoy what was going on? If they are already familiar with how family height measurements work, this worksheet might be easier for them to handle. In the picture, a family has measured their heights. What your kid must do is to look at the line plots and check the line plot that correctly shows the family members’ heights.
-
Activity 4 / Pencil Case Line Plot Worksheet

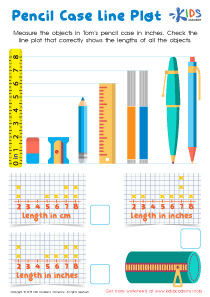
Before beginning this exercise, you must first explain to your child what a line plot is. A line plot is a simple and quick way to organize information. For example, if your child was given a task to do, and the task required organizing different objects for easy identification, a line plot would be the most ideal thing to draw up. In this worksheet, your child will help Tom measure the objects in his pencil case in inches. Ask them to check the line plot that correctly shows the length of all the objects.
-
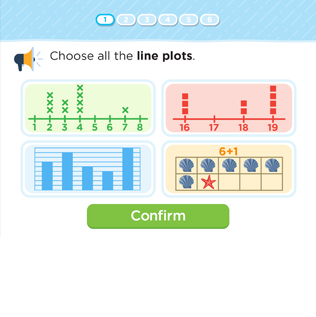
Activity 5 / Line Plots - Quiz
This quiz assesses students’ ability to analyze data from a line plot.


