Questions about Data- How Many - Lesson for Grade 1, Chapter - Keeping Track of Information
In this lesson titled "Questions about Data- How Many," first grade students will embark on an engaging journey into the world of data interpretation and analysis. Through a variety of activities such as Reading a Bar Graph, Julia's Shopping Graph Worksheet, Jane's Pencil Case Worksheet, and the Garden Counting Worksheet, students will learn how to read and interpret data presented in different formats, particularly focusing on quantities and numbers.
This lesson is a crucial component of the "Foundations and Applications in Measuring, Time and Data" unit within the "Keeping Track of Information" chapter. Students will develop foundational skills in understanding and analyzing data, which is essential not only in mathematical contexts but also in everyday situations. They will learn to answer the question, "How many? " in various scenarios, improving their mathematical reasoning and problem-solving skills.
Understanding how to interpret data from graphs and worksheets will equip students with the ability to make informed decisions based on information presented to them. This skill is increasingly important in a world where data is constantly used to convey information in fields ranging from science to business.
-
Activity 1 / Reading a Bar Graph
-
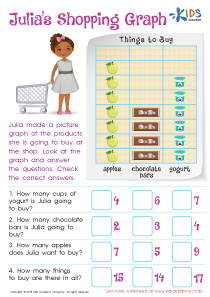
Activity 2 / Julia's Shopping Graph Worksheet
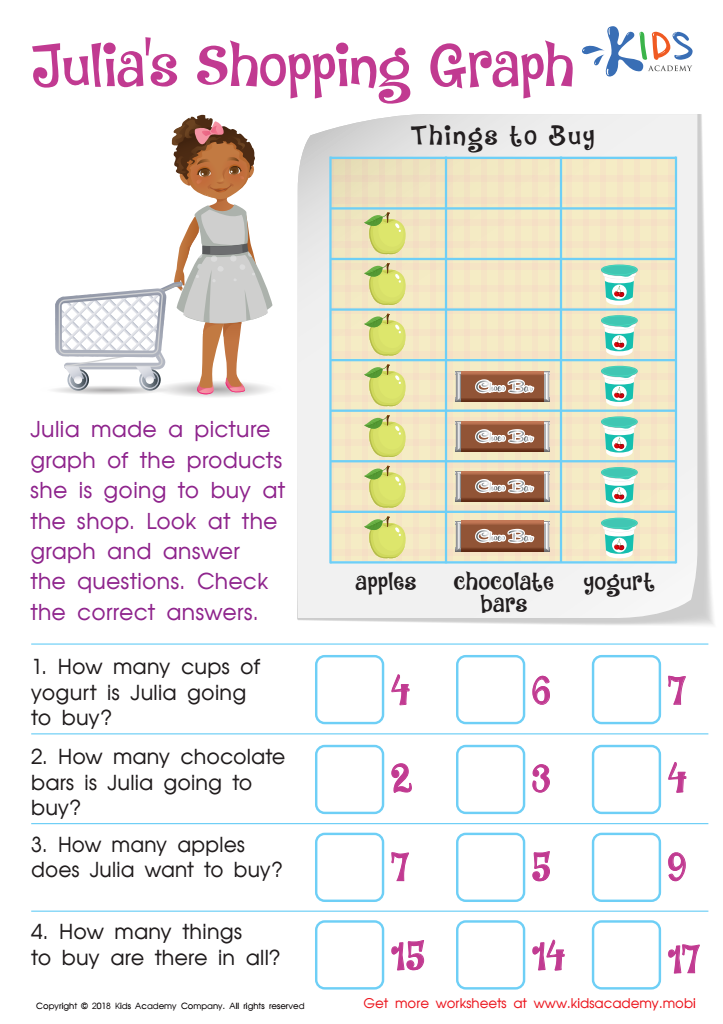
This bright and cheery PDF worksheet is great practice for your little mathematicians working with pictographs. They'll use the information from Julia's graph and answer various questions about the different products she bought. It's a great way to assess your graph reader's understanding of how to read and interpret data from pictographs, but your students just think it's fun to count and choose the correct answer!
-
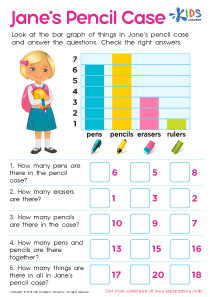
Activity 3 / Jane's Pencil Case Worksheet
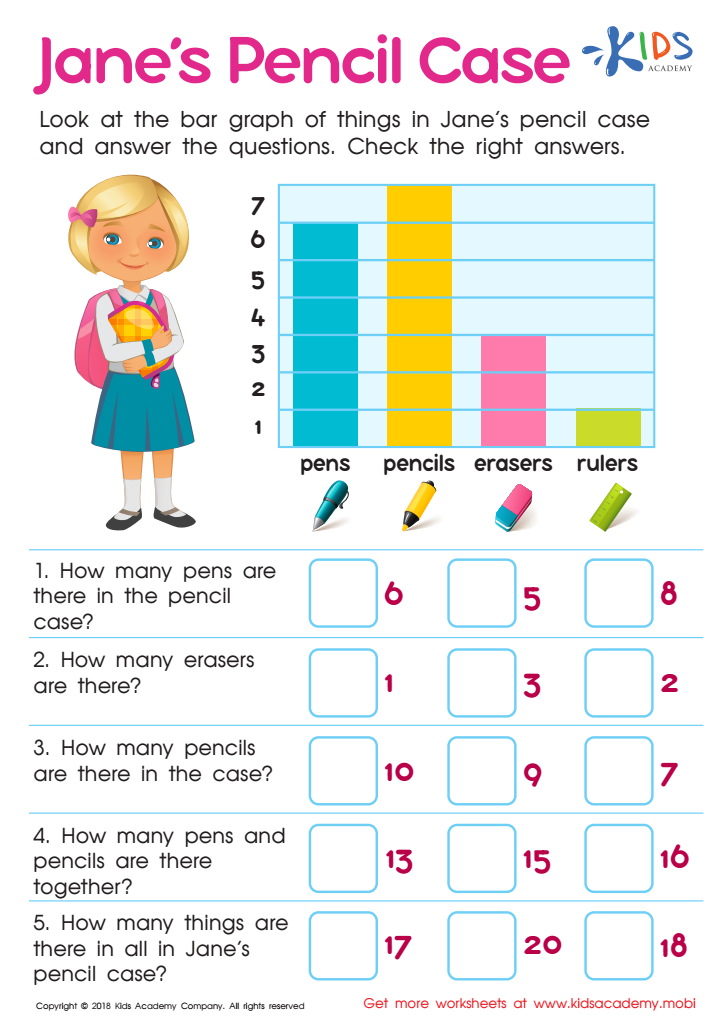
Our friend Jane needs some help organizing her pencil case! Help her sort through her things to see what she has using the bar graph on this vibrant worksheet! While working, your child will practice interpreting a graph while reporting data. Simply look at the information for how many pens, pencils, and other supplies she has, and read each problem. Check the box next to the correct number to complete this fun-filled sheet!
-
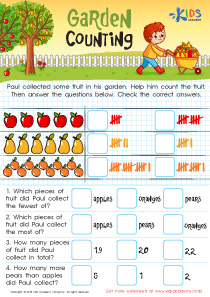
Activity 4 / Garden Counting Worksheet
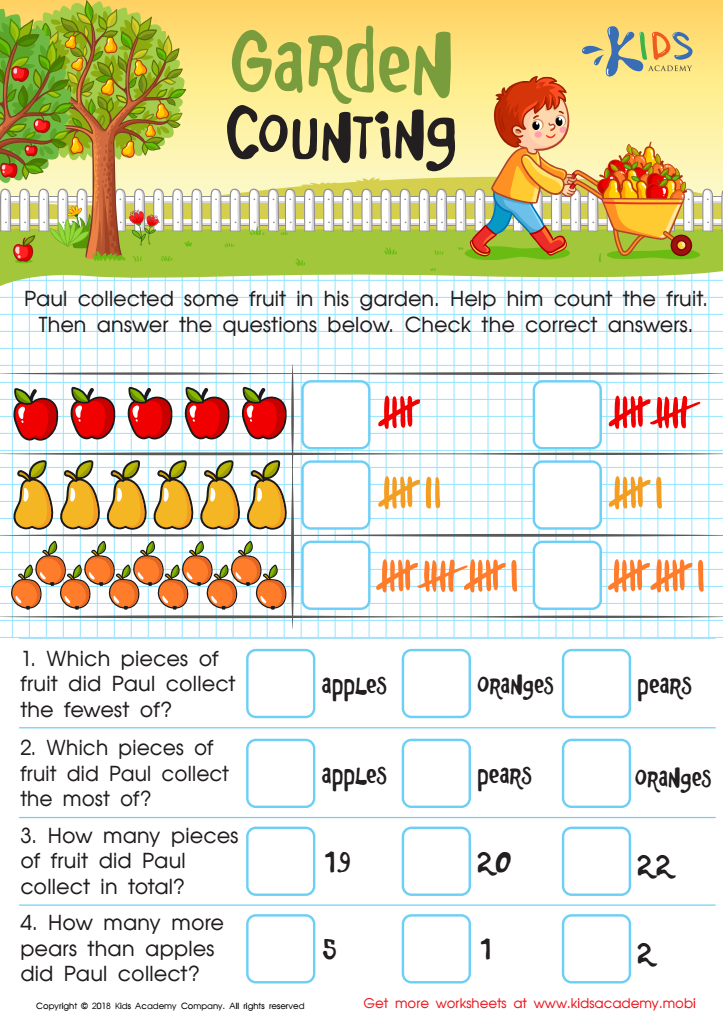
Paul needs some help counting all the fruit he harvested from his orchard! Help him out by completing this delightful and colorful math worksheet! First look at each fruit and count the total our friend collected. Then, check the box that represents the correct tally for each. Finally, answer the questions below to report what he found in all, and to indicate the amount of different types of fruit!


