Questions about Data How Many More - Lesson for Grade 1, Chapter - Keeping Track of Information
In the "Questions about Data: How Many More" lesson, first-grade students embark on an engaging journey through the world of data collection and interpretation. This lesson, nestled within the "Keeping Track of Information" chapter, is a pivotal component of the "Foundations and Applications in Measuring, Time and Data" unit, designed to lay a strong foundation in understanding and utilizing various data representation methods.
Through a series of interactive activities including the "Colorful Balloons Worksheet" on picture graphs, the "Tally Chart: At the Toy Store Worksheet," the "Tree Graph Worksheet," and exercises on answering questions about bar graphs, students will learn to efficiently collect, organize, and interpret data. These skills are crucial as they enable students to make sense of the world around them by observing patterns, making comparisons, and drawing conclusions based on real-life data.
Understanding these concepts at an early age fosters critical thinking, enhances decision-making skills, and prepares students for more complex mathematical concepts in the future. Moreover, mastering these foundational data skills is not just important for academic purposes but also equips students with the ability to analyze information in everyday situations, making this lesson both essential and relevant to their growth and development.
-
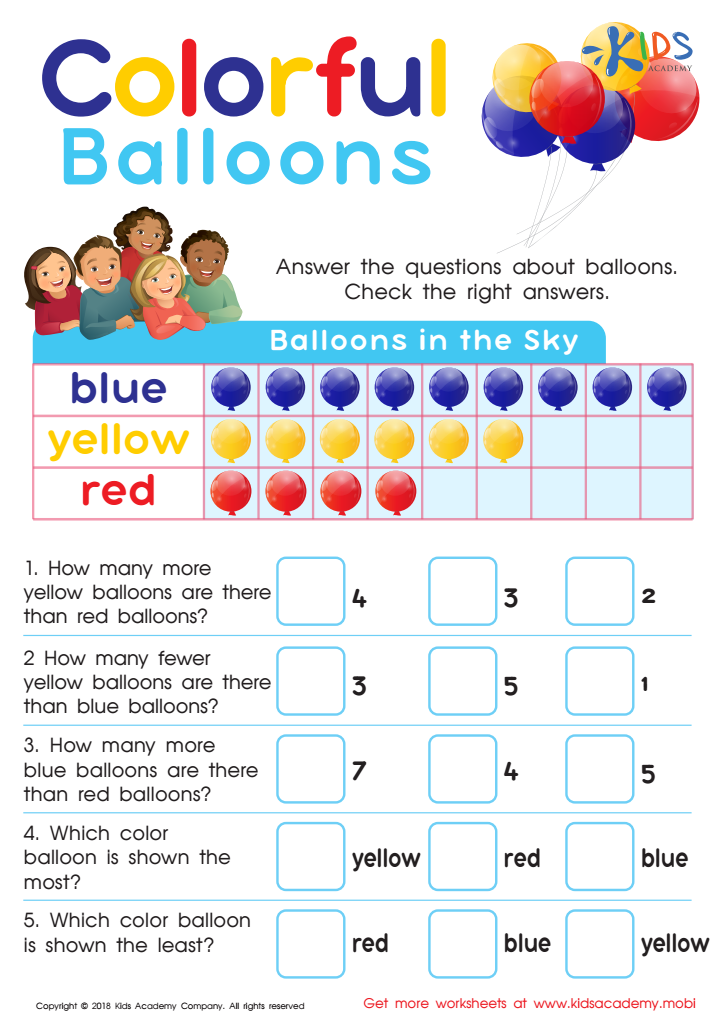
Activity 1 / Picture Graphs: Colorful Balloons Worksheet
All kids love balloons! They’re colorful and are used at parties, making them a positive symbol in the lives of most kids and adults alike. Bring that joy into your child’s studies using this delightful worksheet that will have your kids reviewing a graph while doing math! Simply view the balloons and count how many there are of each color. Then answer the questions below to complete simple realistic math problems and to report critical information about the balloons.
-
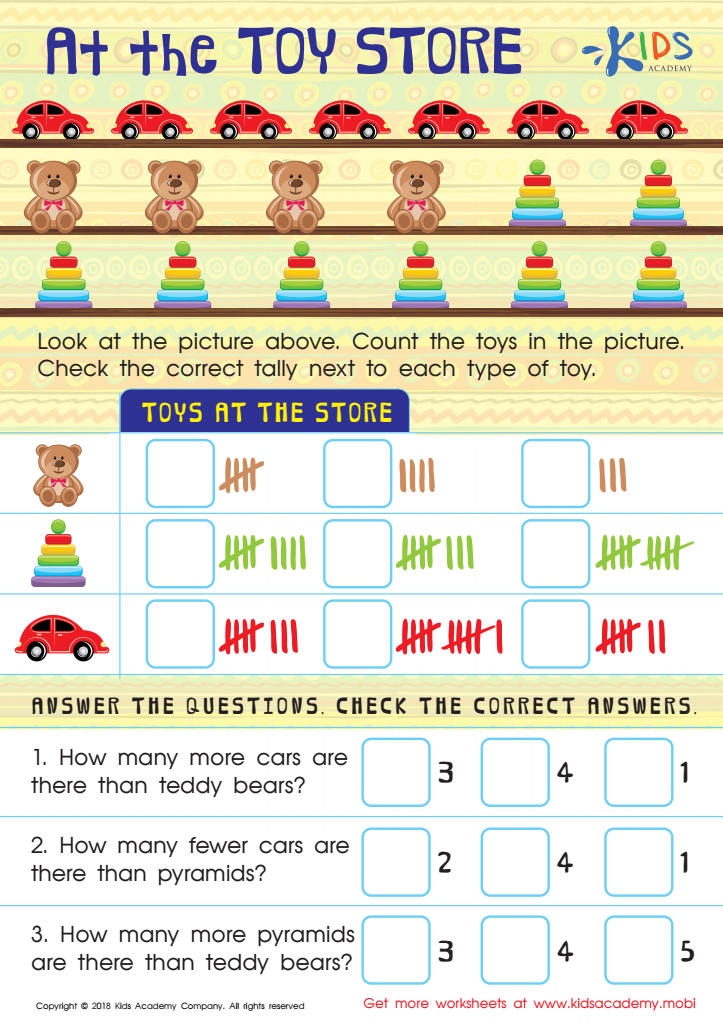
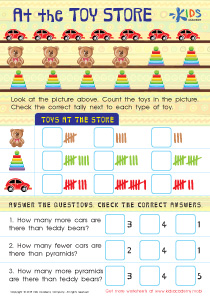
Activity 2 / Tally Chart: At the Toy Store Worksheet
Tally marks help kids keep track of their counting, while learning that one slash of the pencil is equal to one real-life object. Use this adorable worksheet from Kids Academy to practice counting and using tally marks to represent a total! Then, think about the number of toys of each type and how they compare. Towards the bottom of the page, simply help little learners to answer the questions about how many toys they see on this delightful math page!
-
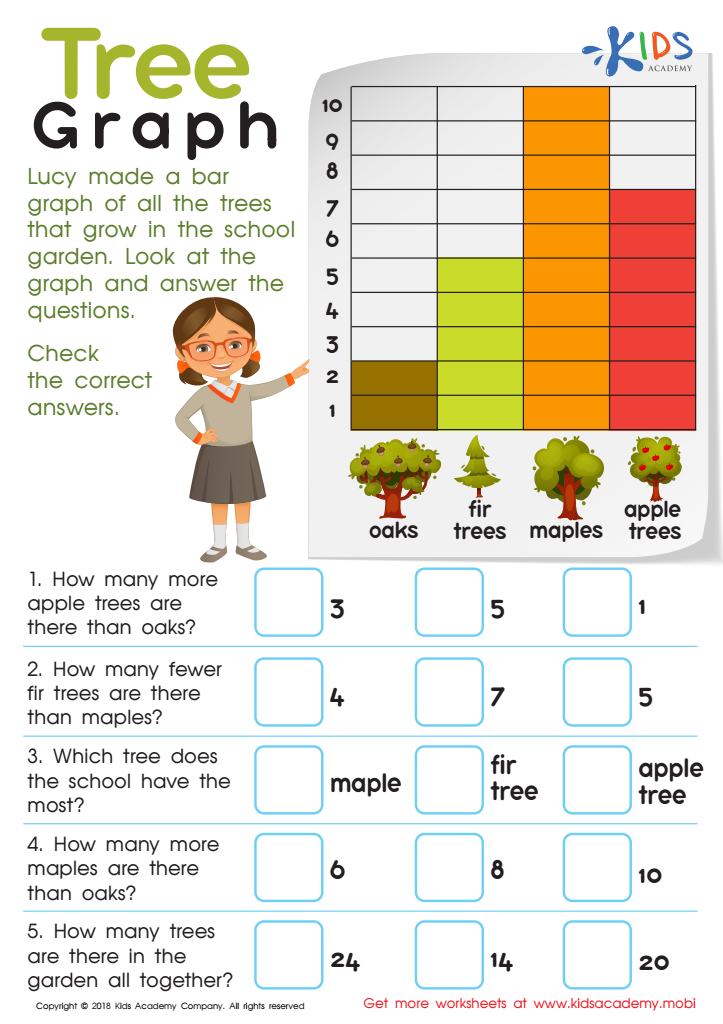
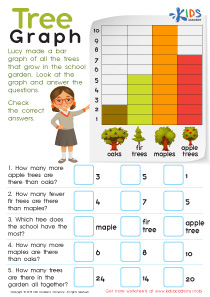
Activity 3 / Tree Graph Worksheet
Learning to read graphs and report data is a basic skill for math and many other subjects! This colorful worksheet contains a bar graph that lists the different types of trees that exist in a school’s garden. Just guide your little mathematician through viewing the graph and answering the questions below. To extend this lesson, help your child or students create their own tree graph to list the numbers and types of trees at their own school or at home!
-
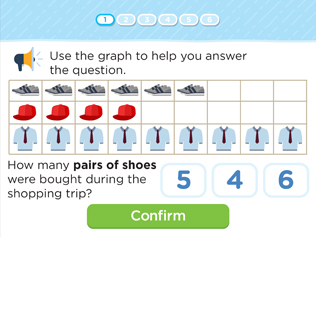
Activity 4 / Answering Questions About Bar Graphs - Quiz
This quiz assesses students’ ability to gather information from data in bar graphs and picture graphs.

