Data Essential Activities for Grade 2
Videos
(1/3)
Alien Math: Bar Graphs
Welcome our new video: Bar Graphs for 1st Grade Kids.
Kids Academy will help your child practice and apply basic math skills through fun puzzles and mini-games in our application.
Kids Academy will guide your little math explorer through intuitive lessons with the help of our professors. This App combines math and fun while mastering the basic Common Core Math Curriculum – math has never been so FUN until NOW!
A line plot is an excellent type of graph to use to organize data. When using a line plot, the data is displayed as points, checkmarks or an X above the numbers on a number line. Line plots are great when there aren’t many numbers to chart.
In the video, the teacher measures 6 airplanes with a centimeter ruler. On the whiteboard, he records the data from each measurement. He completes the measurement and then arranges the numbers from smallest to largest. At the bottom of the page, he enters the data on the line plot by tracing an X above the numbers that represent the data collected.
Have fun in your math class with hands-on measuring and line plot activities:
• Each student measures one foot to the nearest inch and records the data on a line plot.
• Students jump from a stationary position and measure the length to the closest foot and records the data.
• Measure the length of a thumb or finger to the nearest centimeter and plot the data on a line plot.
This video provides instruction on picture graphs. Picture graphs use pictures instead of numbers to show the data. Students practice reading the data on a picture graph and then answer word problems using the information from the graph to find the answers.
The picture graph shows how many cups of coffee a coffee shop sold on each day over four days. The teacher instructs the students on how to read the graph. Then, there are four questions to answer. The questions vary in complexity. For example, one question asks: On which day were 10 cups of coffee sold? Another question is more complex: How many more cups of coffee were sold during the second day than the first day? The teacher carefully explains how to solve each word problem.
Pictures graphs are great for teaching children about organizing data. Students use higher-order thinking skills when interpreting and analyzing the data and a picture graph is child-friendly and ideal for primary age students.
Worksheets
(1/9)
Football Math Worksheet

Picture graphs are an engaging way to motivate your child to learn to read graphs! This fun and sporty picture graph worksheet PDF uses football as a basis for comparing teammates and their touchdowns!
Your little sports fan will love learning to read graphs and analyze data with this entertaining worksheet!
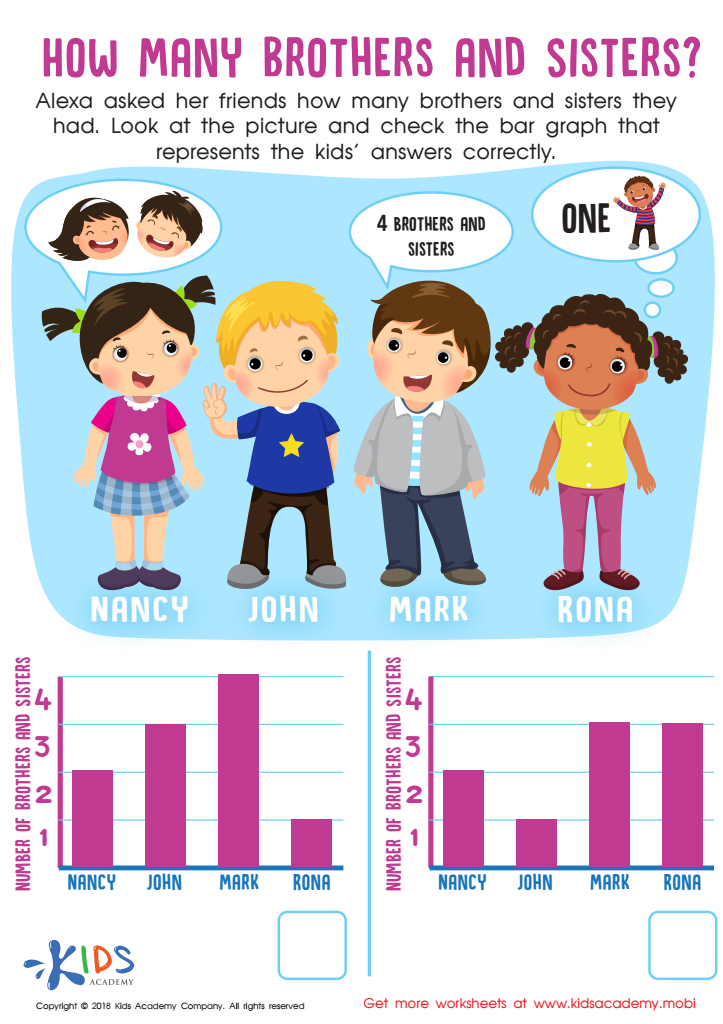
Can your child tell you how many siblings their friends have? Can they tell you? In this worksheet, Alexa has asked her friends how many brothers and sisters they have. Her friends have given her different answers, as shown in the picture. Ask your child to carefully look at the picture and use it to check the bar graph that represents Alexa’s friends’ answers correctly.

Your child will be delighted to help Santa measure the length of all his presents using this line plot worksheet for 2nd grade!
Building basic math skills include learning to read a basic graph to analyze data. Line plots are a great way to build graphing skills, and this worksheet will also serve to build your child’s skills in measurement!
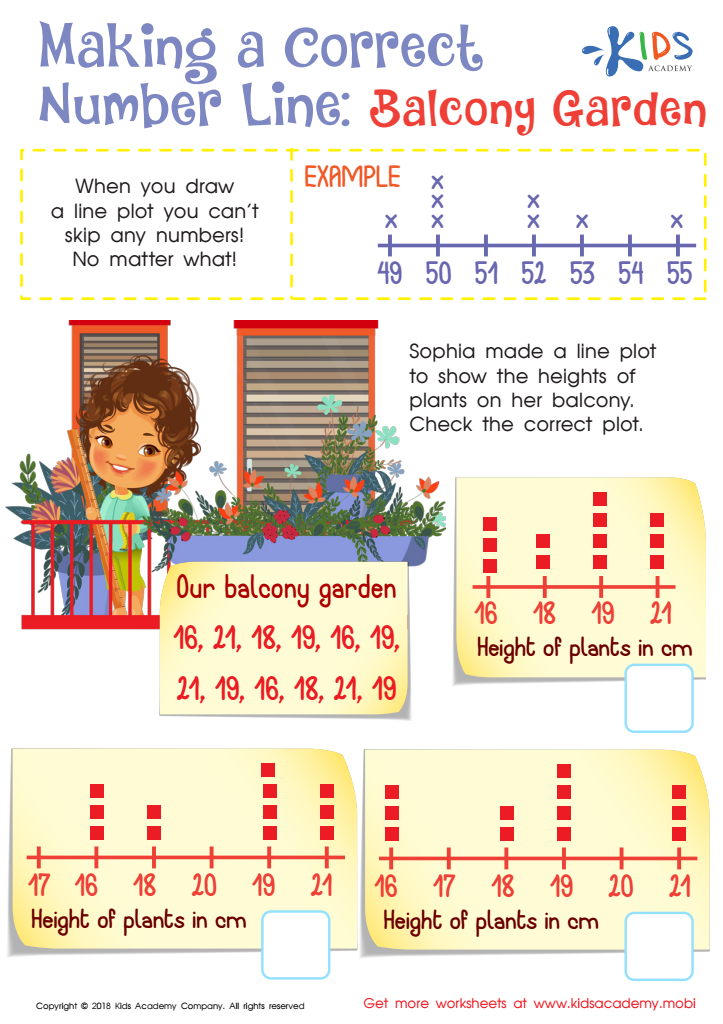
A line plot is a simple and quick way to organize information, and your child will need this skill to properly organize objects. Teaching your child how to properly draw and identify a line plot is essential, and you can use this worksheet to do just that. When you draw a line plot, you must remember that you can never skip any numbers. In this exercise, Sophia made a line plot to show the heights of plants in her balcony. Ask your child to help Sophia check the correct plot.
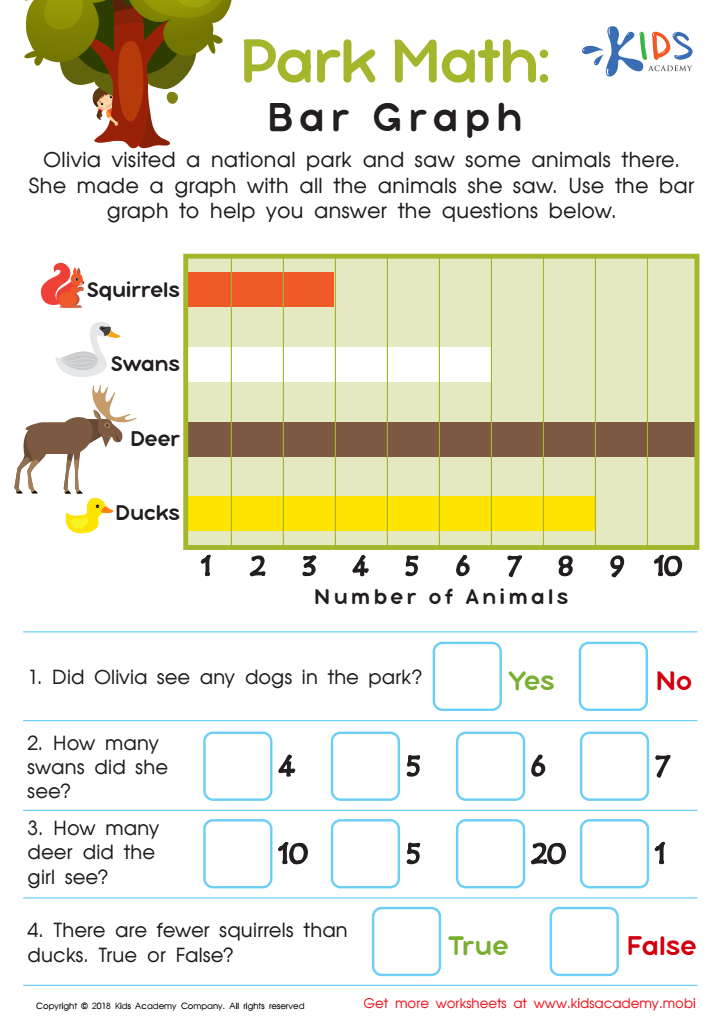
Do your kids love the park? How often do you visit, and can they tell you some of the animals they are particularly fond of at the park? In this worksheet, your kids will be introduced to Olivia who has just visited a National Park and saw some animals there. Olivia made a graph with all the animals she saw to help her give proper account. Ask your child to use the bar graph to help them answer the questions given down below.

Before beginning this exercise, you must first explain to your child what a line plot is. A line plot is a simple and quick way to organize information. For example, if your child was given a task to do, and the task required organizing different objects for easy identification, a line plot would be the most ideal thing to draw up. In this worksheet, your child will help Tom measure the objects in his pencil case in inches. Ask them to check the line plot that correctly shows the length of all the objects.
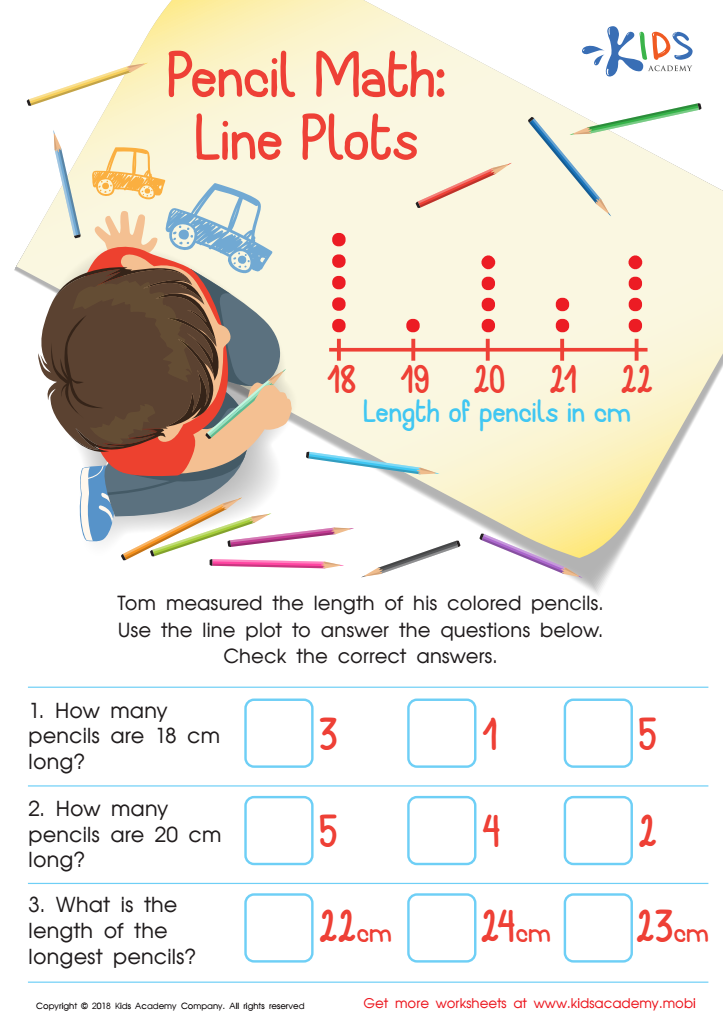
Your kids will meet Tom in this worksheet, and help him figure out the lengths of his colored pencils. Tom has written the lengths of his pencils in centimeters. Help your child use the line plot to answer the questions in the worksheet below. Help them check the correct answers for each question. Some of the questions your kids will need to answer involve the number of pencils that are a certain length. Using the line plot, they should be able to easily find the answers.
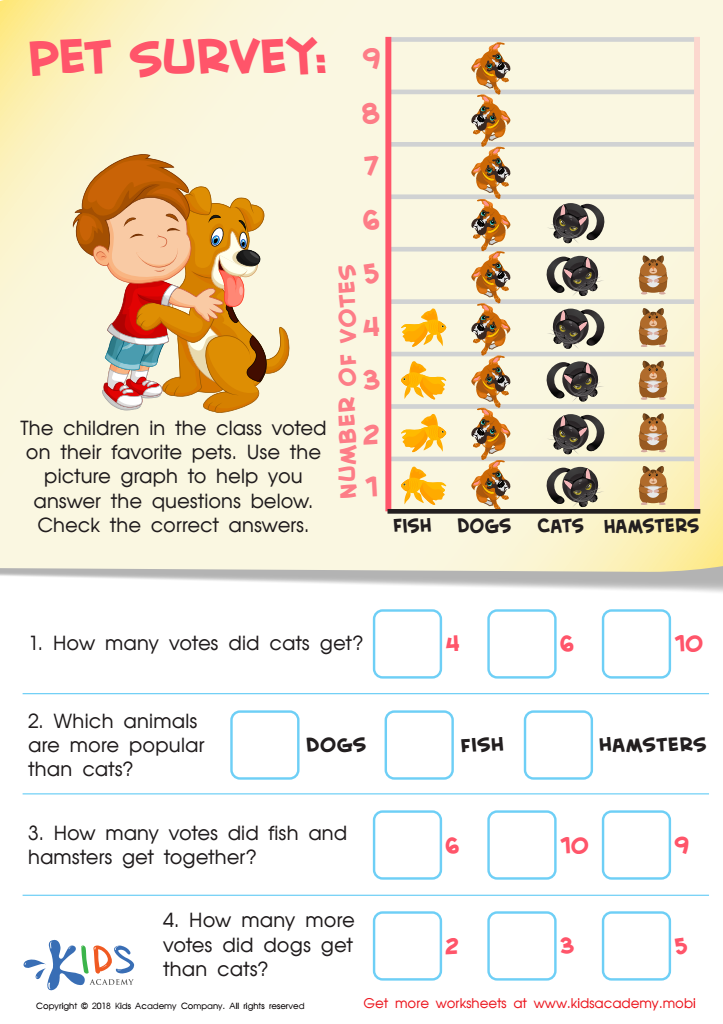
Do you already have a furry friend as a member of your family? If you do, and your kids particularly love animals, they might find this worksheet a much more enjoyable exercise. The children in this picture have voted on their favorite pets. The pets they have voted on are fishes, dogs, cats, and hamsters, and the votes have been represented in a picture graph. Ask your child to look at the picture graph and use it to help them answer the questions in the printout. Help your child check the correct answer for each question.
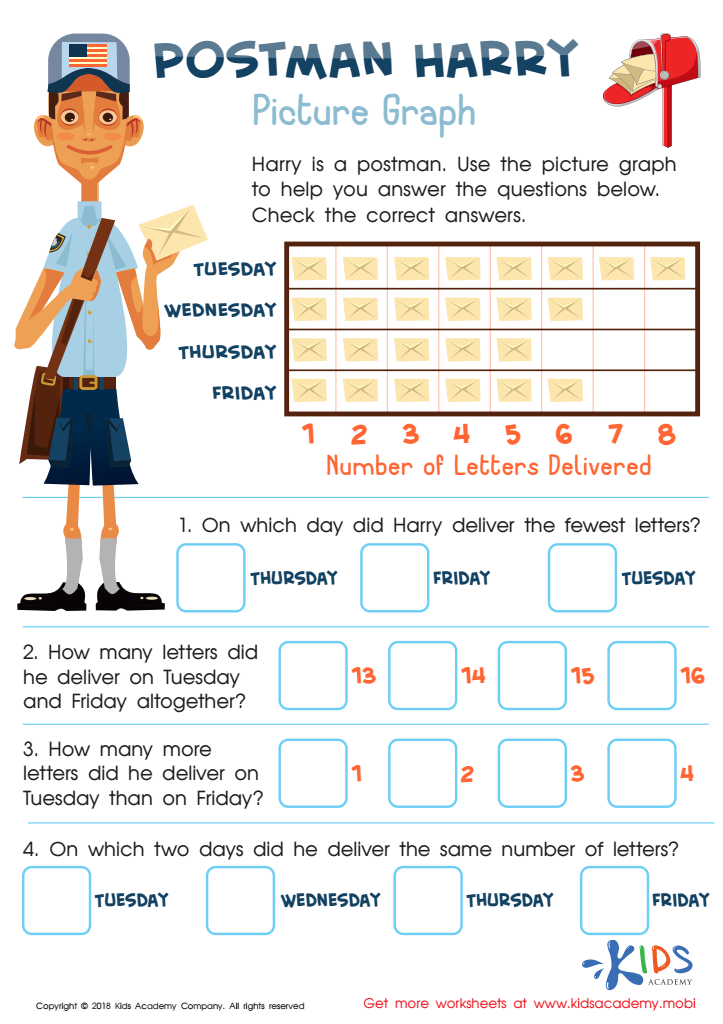
Can your kids easily identify different professions by the workers’ outfit? Show them a picture of Harry the Postman in this worksheet. Did they know what his job is? In this simple picture graph worksheet, your kids will need to help Harry. There is a picture graph showing the number of letters he delivered, and on what day he delivered the letters. Using the picture graph, ask your kids to answer the questions below the picture graph.
Quizzes
(1/1)
Answering Questions About Bar Graphs
This quiz assesses students’ ability to gather information from data in bar graphs and picture graphs.
This window will close in a few seconds…
This window will close in a few seconds…

