Math Lesson - Enrichment, Keeping Track of Information, Grade 1
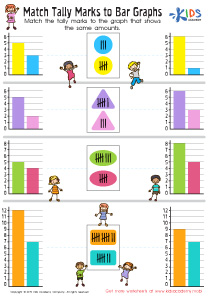
In the "Enrichment" lesson, designed for Grade 1 students under the unit "Foundations and Applications in Measuring, Time and Data," learners will embark on an engaging journey to comprehend the basics of organizing and interpreting data. Specifically, the lesson's central activity involves a worksheet where students match tally marks to their corresponding bar graphs. Through this hands-on approach, learners will gain a foundational understanding of two crucial data representation methods.
Understanding how to translate information from tally marks to bar graphs is not just an academic exercise; it's a vital skill that builds the basis for mathematical reasoning and problem-solving abilities in everyday life. By learning how to keep track of information accurately, students develop attention to detail and the capacity to visualize numerical information, making it easier to comprehend and communicate findings.
Moreover, this lesson emphasizes the importance of organizing data effectively, a skill that aids in making informed decisions based on clear, visual representations of information. As students master these foundational concepts, they are better equipped to tackle more complex mathematical challenges in the future, laying the groundwork for a lifelong journey of learning and discovery.
-
Activity 1 / Match Tally Marks to Bar Graphs Worksheet

Learning mathematics can be a sore subject for your kids. There are a lot of rules in math which we must follow, and there are also complicated formulas to learn. Right now, your kids won’t be getting into the really deep parts of mathematics, but they have their fair share of equations to deal with. Use this worksheet to help them understand graphs better. Look at the printout and help your kids match the tally marks to the graph that shows the same amount.


