Making Precise Line Plots - Lesson for Grade 3, Chapter - Graphing
In the "Making Precise Line Plots" lesson, third-grade students will embark on a mathematical journey exploring the fascinating world of graphing. This lesson is nestled comfortably within the broader Data, Geometry, Area, and Perimeter unit, offering a focused lens on how to accurately represent and interpret data using line plots. Throughout a series of engaging activities - including the Leaf Measure, Seedling Measure, and Swim Race Line Plot Worksheets, coupled with Two-Step Graphing Word Problems and Line Plots - students will hone their skills in measuring, collecting, and plotting data on line plots.
Learning to create precise line plots is a foundational skill in understanding the graphical representation of data. This ability is crucial for students as it enhances their analytical skills, enabling them to visually compare and contrast quantities, identify trends, and make informed predictions based on real-world data. Moreover, mastering line plots at this stage prepares students for more complex mathematical concepts and data analysis techniques in future grades. Through hands-on activities that relate to their everyday experiences, students will find relevance and enjoyment in this essential aspect of math, fostering a deeper appreciation for the role of data in understanding the world around them.

-
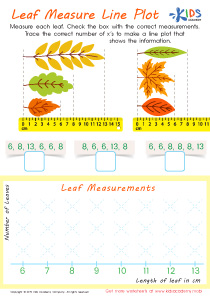
Activity 1 / Leaf Measure Line Plot Worksheet

Line plots are not particularly difficult to understand, but your students might not be so excited to learn the topic. It is up to you, as their teacher, to guide them through the learning process with simple exercises that can stimulate their thinking. In this worksheet, there are four leaves. Help your third grader measure each leaf, and then check the box with the correct measurements. After that, trace the correct number of x’s to make a line plot that shows the information.
-
Activity 2 / Seedling Measure Line Plot Worksheet
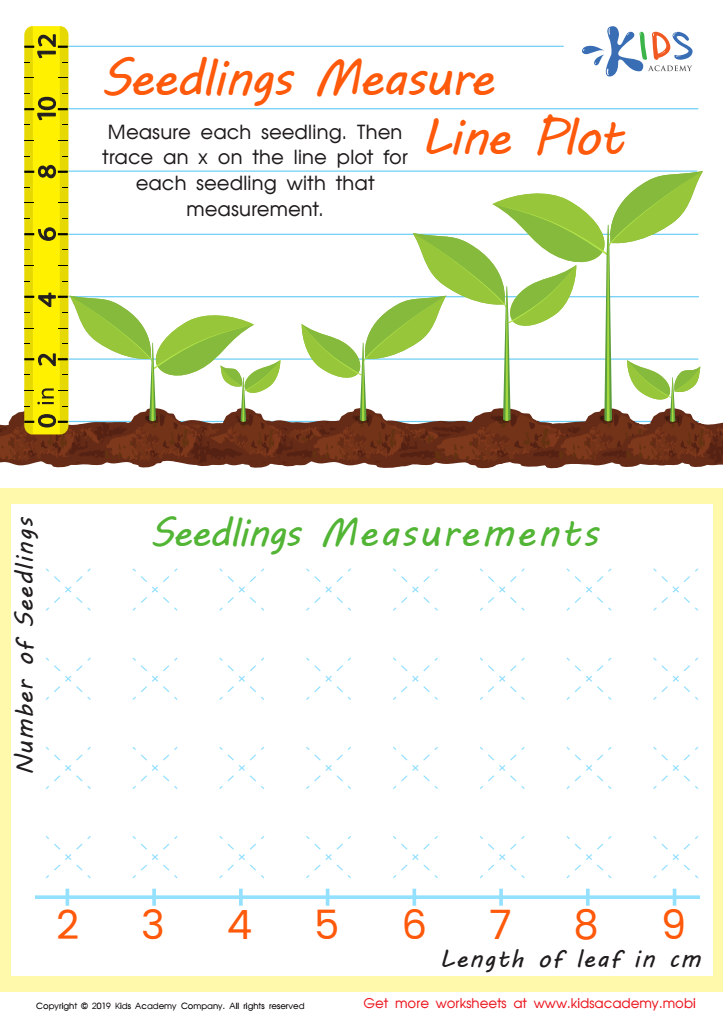
If your kids are now learning line plots in school, this worksheet might be the right exercise to get them well adjusted to learning. Your children might not particularly enjoy math, but learning with this fun tracing sheet will be enjoyable for them. In the picture, help your kids measure each seedling, and then trace an x on the line plot for each seedling with that measurement. Assist your kids in completing this simple exercise.
-
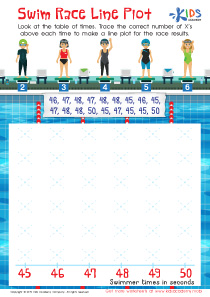
Activity 3 / Swim Race Line Plot Worksheet

Children are great learners, and they soak up everything you teach them in class. However, they might still struggle with some aspects of mathematics, and if you find that your kindergartners need some more help with line plots, use this simple worksheet to make their learning easier. Look at the picture with your students. There is a table of times; help your kids trace the correct number of x’s above each time to make a line plot for the race result.
-
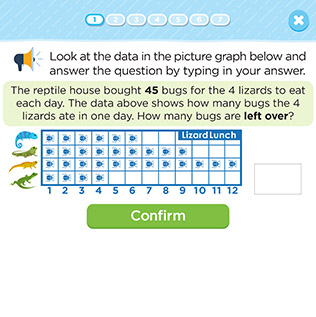
Activity 4 / Two-Step Graphing Word Problems and Line Plots - Quiz
This quiz assesses students’ ability to solve two-step graphing word problems and making line plots.


