
Understanding graphs Graphs Worksheets for Ages 3-9
5 filtered results
Difficulty Level
Grade
Age
-
From - To
Subject
Activity
Standards
Unlock your child's potential with our "Understanding Graphs" worksheets, crafted for ages 3-9. These engaging activities are designed to introduce young learners to interpreting and creating graphs through fun, age-appropriate exercises. Build foundational skills in data analysis, pattern recognition, and critical thinking while enhancing math confidence. Whether it's simple bar graphs or pictographs, our carefully curated worksheets are perfect for both home and classroom environments. Help your child master the basics of graph comprehension and set them on the path to academic success with Kids Academy's dynamic learning resources.
Favorites
With answer key
Interactive

Recycling Picture Graph Worksheet
This worksheet can help kindergartners learn numbers and why recycling is important. After using items and materials, they can turn them into new materials instead of throwing them away. Guide your students to follow the instructions and answer the questions at the end. Help them understand how recycling benefits our environment.
Recycling Picture Graph Worksheet
Worksheet

Fruit Math: Picture Graphs Worksheet
Help your child learn to draw graphs by having them look at pictures. Ask them to identify a graph that accurately portrays the data and have them explain why. This will prepare them to easily draw more complex graphs in the future. For example, have them look at the picture with the number of fruits in the colorful worksheet and explain why the graph is accurate.
Fruit Math: Picture Graphs Worksheet
Worksheet
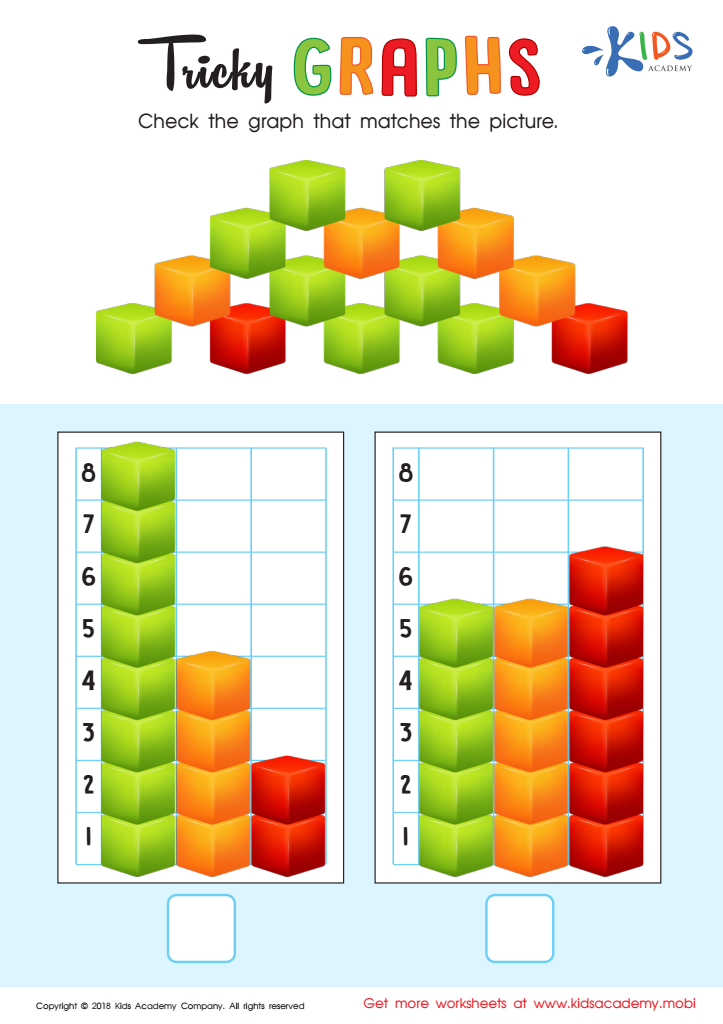
Tricky Graphs Worksheet
Looking for a fun way to sharpen your kid's graphing skills? Get this colorful PDF worksheet! They'll get to practice visual discrimination, counting, and creating bar graphs. Plus, graphing and reading graphs are essential for problem-solving in math.
Tricky Graphs Worksheet
Worksheet

Match Tally Marks to Bar Graphs Worksheet
Learning math can be tough for kids. Rules and formulas can be confusing. Don't worry, this worksheet can help them understand graphs better. Show them how to match the tally marks with the graph that shows the same amount. It will help them grasp the basics and prepare them for more complex equations.
Match Tally Marks to Bar Graphs Worksheet
Worksheet

Aircraft Carrier Picture Graphs Worksheet
Kids love learning about jets and boats with this awesome worksheet! It's a great way to engage them as they work on picture graphs. Representing numerical values with pictures, this free PDF requires them to choose which picture graph and representation best match the carrier in the picture. It's also great practice for visual discrimination!
Aircraft Carrier Picture Graphs Worksheet
Worksheet
Join Kids Academy for Free
Who is primarily going to use this learning content?


Understanding graphs from an early age equips children with essential cognitive and foundational skills that are crucial for their academic and real-life problem-solving abilities. For ages 3-9, engaging with graphs promotes visual literacy, which helps in the interpretation of visual information—a skill increasingly important in our data-driven world. Graphs enable young learners to visualize and better understand concepts of quantity, comparison, and trends, establishing early mathematical competence.
From a developmental perspective, introducing graphs aids in enhancing critical thinking and analytical skills. When children learn to read graphs, they practice observing details, making predictions, and drawing conclusions, fostering their ability to think logically and critically. Graphs can represent information in a simplified, engaging manner, which keeps young minds intrigued and motivated to explore further.
Moreover, integrating graphs into learning fosters cross-disciplinary connections. For example, a science lesson on weather patterns can utilize simple bar or line graphs to track temperatures, creating a vivid, integrated learning experience. Parents and teachers who focus on building this skill during early childhood not only empower children to handle more complex data in future academic endeavors but also stimulate their curiosity—an invaluable trait for lifelong learning and innovation. By making graphs a part of early education, we are equipping children with tools to decode the world around them systematically and enjoyably.


