Understanding graphs Grade 1 Numbers Worksheets
3 filtered results
-
From - To
Welcome to our "Understanding Graphs" worksheets for Grade 1! Designed to enhance young learners' comprehension of basic graphs and data interpretation, these engaging activities help students recognize and analyze information visually. Through colorful, easy-to-understand worksheets, kids will explore bar graphs, pictographs, and line plots, making math concepts accessible and fun. Each worksheet encourages critical thinking and problem-solving skills, preparing students for more advanced mathematical concepts. Perfect for classroom use or at-home practice, these resources foster an early love for numbers and data. Start your child's journey into the world of graphs today with our interactive and educational materials!

Making a Graph: Creepy Crawlies Worksheet
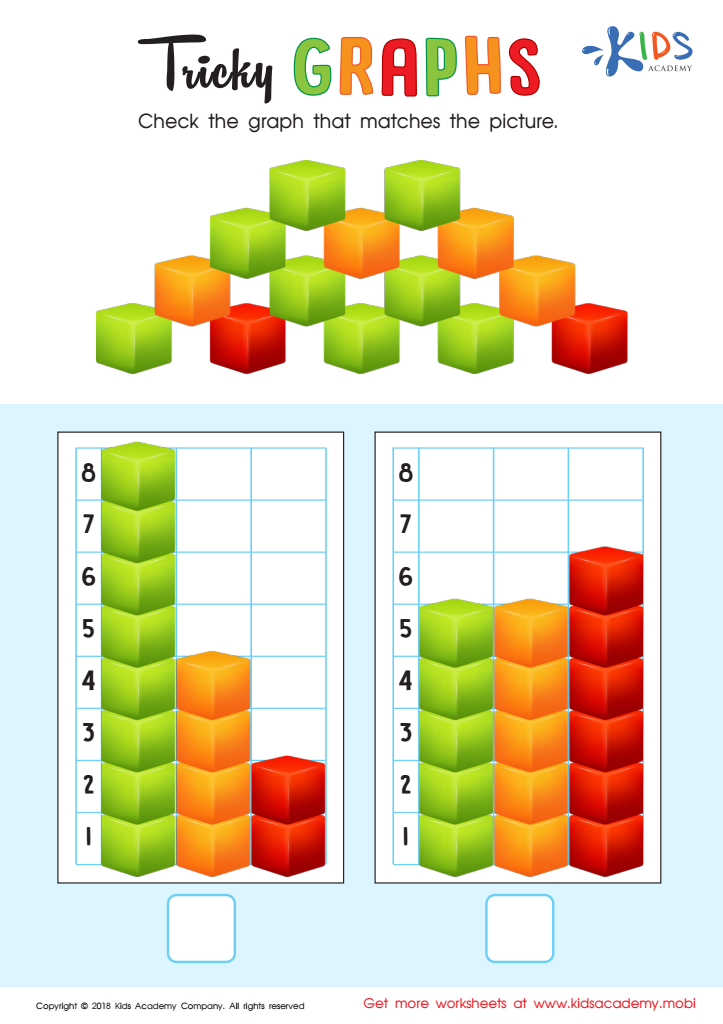
Tricky Graphs Worksheet

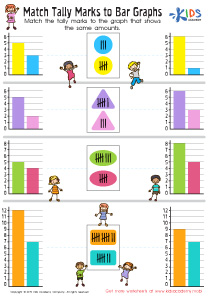
Match Tally Marks to Bar Graphs Worksheet


Understanding graphs in Grade 1 is crucial for both parents and teachers, as it lays a foundational skill in data literacy essential for students' future academic success. Visual representations of data, like graphs, help children make sense of the world around them. Introducing graphs at this early stage fosters critical thinking, enabling students to analyze, interpret, and draw conclusions from information. It encourages them to recognize patterns, compare quantities, and identify trends.
Moreover, graphs make learning engaging and interactive. Young learners can relate to real-life scenarios—like comparing their favorite fruits or pets—which enhances their interest in mathematics. Familiarity with graphs can also improve their communication skills, allowing them to articulate observations clearly.
For parents, this understanding leads to effective support for their child's homework and learning activities, creating an enriching home environment. It empowers them to engage in data-related discussions, stimulating curiosity and critical inquiry.
For teachers, guided graphing activities present opportunities for hands-on learning that reinforce concepts of addition, subtraction, and measurement. Overall, grasping the basics of graph interpretation promotes essential skills that transcend mathematics, equipping children with the necessary tools to navigate and understand information in our data-driven world.