Understanding graphs Worksheets for Ages 3-9
6 filtered results
-
From - To
Explore our "Understanding Graphs Worksheets" designed for children aged 3-9, where little learners embark on an exciting journey into the world of data visualization! This engaging collection provides playful and interactive activities that help young minds grasp the basics of graphs and charts. From bar graphs to pictographs, our worksheets are crafted to simplify complex concepts, making learning fun and accessible. With vibrant visuals and kid-friendly instructions, children will develop essential skills in organizing, interpreting, and analyzing data, laying a strong foundation for future math success. Perfect for at-home learning or classroom use, these worksheets ignite curiosity and foster critical thinking!

Recycling Picture Graph Worksheet

Making a Graph: Creepy Crawlies Worksheet

Fruit Math: Picture Graphs Worksheet
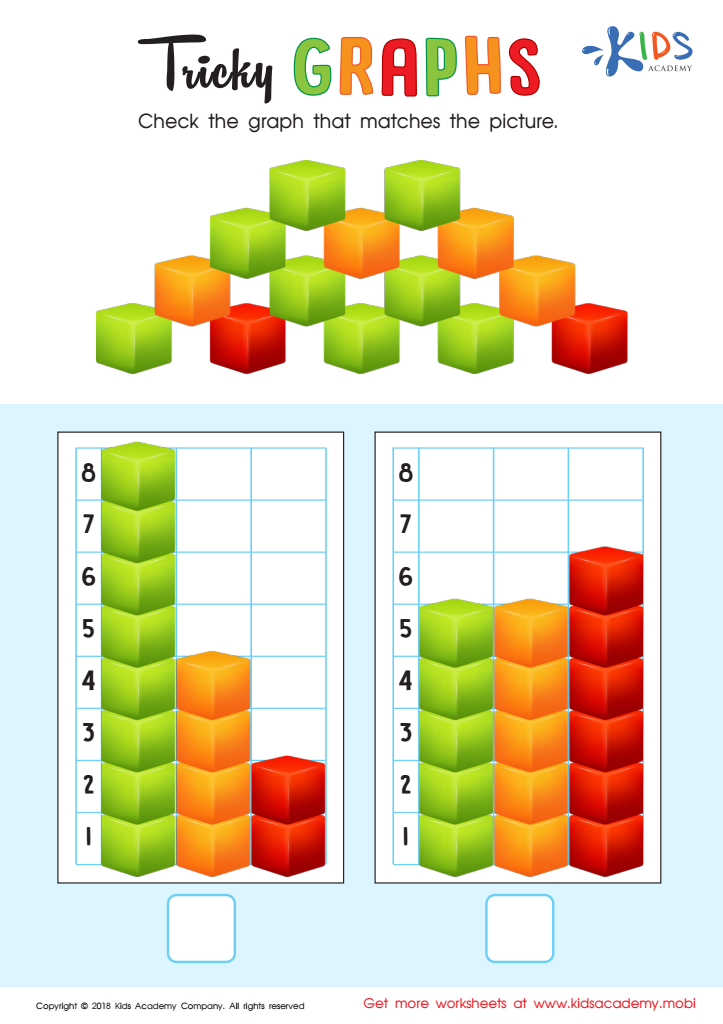
Tricky Graphs Worksheet

Match Tally Marks to Bar Graphs Worksheet

Aircraft Carrier Picture Graphs Worksheet


Understanding graphs is crucial for children aged 3-9 as it lays the foundation for critical thinking and problem-solving skills. During early childhood, children are naturally curious and eager to make sense of the world around them. Learning to read and interpret graphs helps them visualize data, comprehend relationships, and recognize patterns, which are essential skills in various disciplines, including math, science, and social studies.
Moreover, graphs can make complex information accessible. For example, simple bar graphs can help children understand comparisons, while pictographs can introduce them to the concept of data representation. By integrating graph-reading skills into their education, parents and teachers encourage children to engage with data analytically, fostering a mindset that embraces inquiry and exploration.
Additionally, graphing activities can promote collaboration and communication skills as they discuss their findings with peers or family members. This hands-on learning experience builds confidence and reinforces the understanding that data is everywhere in everyday life, from sports statistics to weather forecasts. Ultimately, mastering graph interpretation at a young age cultivates informed citizens who are capable of making evidence-based decisions in their futures. Parents and teachers should prioritize graph education for its long-lasting impact on cognitive development and analytical skills.


