Understanding graphs Math Worksheets for Ages 5-6
3 filtered results
-
From - To
Discover an engaging collection of "Understanding Graphs" math worksheets designed specifically for children ages 5-6. These resources aim to make learning fun while introducing young learners to essential graph concepts, including bar graphs, pictographs, and simple data representation. Each worksheet is crafted to support skill development in sorting, comparing, and interpreting data, fostering critical thinking from an early age. Perfect for classroom use or homework, these worksheets ensure that children build a solid foundation in math through interactive and colorful activities. Equip your little ones with the knowledge they need to understand graphs and enhance their math skills playfully and effectively!

Making a Graph: Creepy Crawlies Worksheet
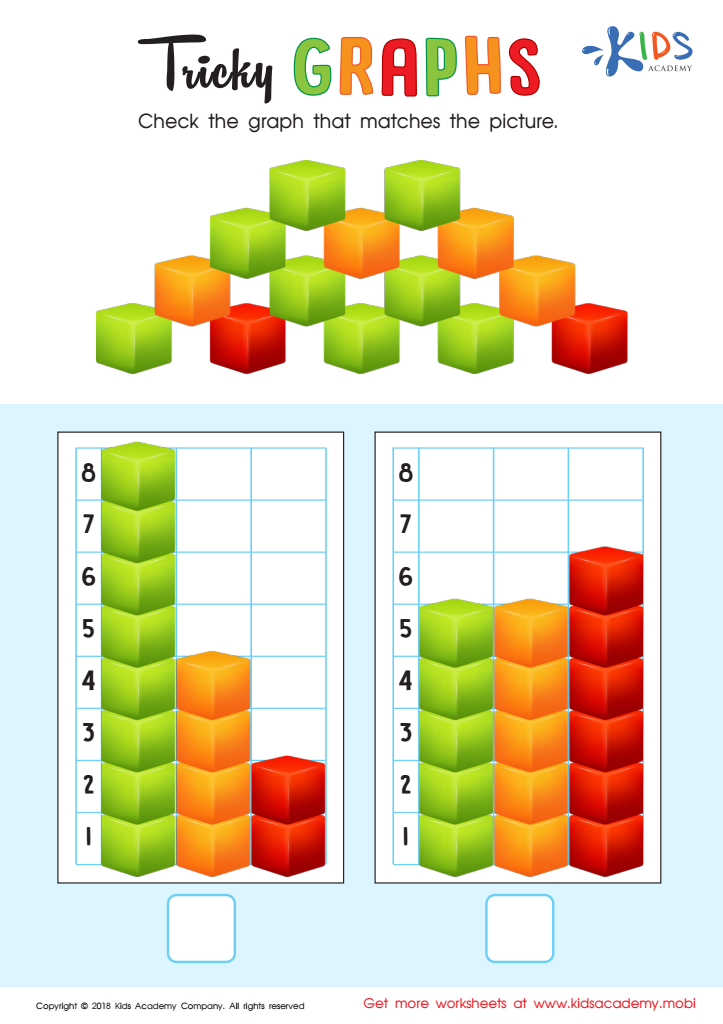
Tricky Graphs Worksheet

Match Tally Marks to Bar Graphs Worksheet


.jpg)

Understanding graphs is a crucial mathematical skill that has numerous benefits for children ages 5-6. First, graphs are visual tools that help young learners comprehend complex data in an accessible way. By engaging with graphs, children develop critical thinking skills as they learn to interpret information presented visually. This ability hones their analytical skills, preparing them for more advanced mathematics in the future.
Second, early exposure to graphs can enhance children’s interests in math and science. When children visualize data through pictures and diagrams, it stimulates curiosity and makes learning more enjoyable. For instance, creating a simple bar graph to track their favorite fruits can link personal experiences to mathematical concepts, making learning relevant and fun.
Additionally, understanding graphs fosters communication skills, as children learn to explain information. Parents and teachers play a vital role in modeling this understanding, asking questions about the information presented in graphs, and encouraging children to share their interpretations.
Overall, early engagement with graphs lays a foundational understanding of patterns, relationships, and storytelling through data. This foundation prepares children for a world increasingly driven by data, and empowers them to become confident, informed individuals as they progress in their education.


