Understanding graphs Graphs Worksheets for 7-Year-Olds
3 filtered results
-
From - To
Dive into the exciting world of graphs with our "Understanding Graphs Worksheets" specifically designed for 7-year-olds! These engaging worksheets help young learners develop essential skills in interpreting and creating different types of graphs, such as bar graphs, line graphs, and pictographs. Through colorful visuals and interactive activities, children will enhance their ability to analyze data and understand relationships between quantities. Our user-friendly resources foster critical thinking and boost confidence in math. Perfect for classroom use or at-home practice, these worksheets provide a fun and effective way for kids to grasp graphing concepts in an inclusive learning environment. Explore and watch them thrive!

Fruit Math: Picture Graphs Worksheet
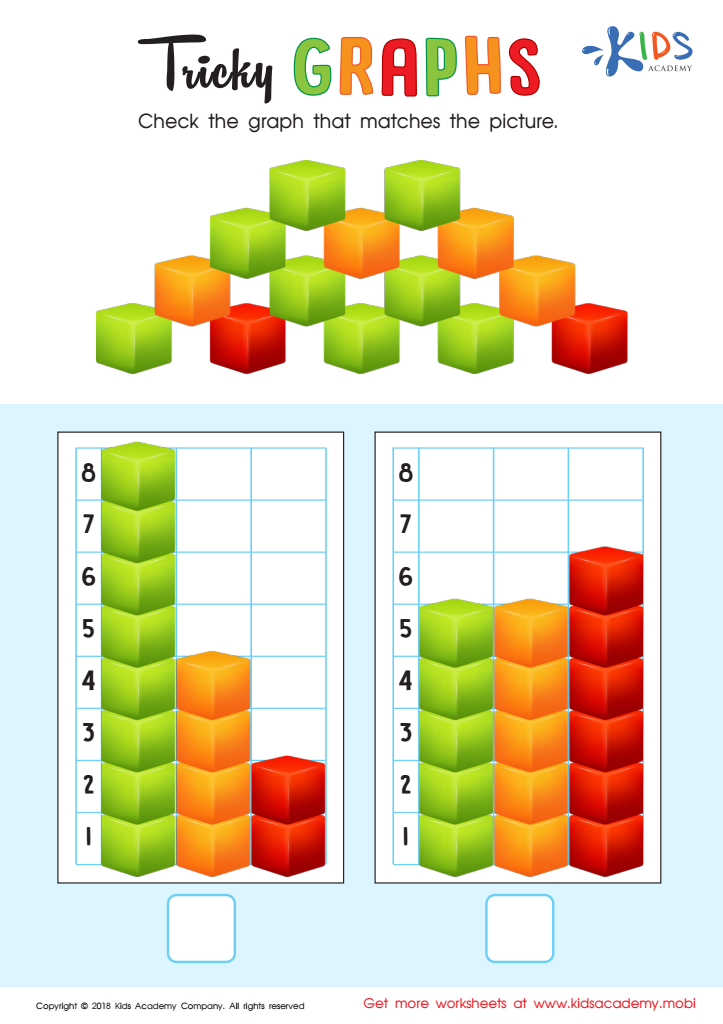
Tricky Graphs Worksheet

Match Tally Marks to Bar Graphs Worksheet


Understanding graphs is crucial for seven-year-olds as it lays the foundation for critical thinking and analytical skills. At this age, children begin to develop their ability to interpret and represent data visually, which is an essential skill in today's information-driven world. By learning how to read, interpret, and create various types of graphs—such as bar graphs, line graphs, and pictograms—children can grasp fundamental concepts of statistics and data analysis.
Parents and teachers should care about this because graph literacy encourages children to engage actively with the world around them. It fosters curiosity and helps them make sense of everyday information, such as sports scores, weather patterns, or survey results. Understanding graphs enhances decision-making abilities and promotes mathematical development, which is vital in their educational journey.
Furthermore, integrating graph education into early learning can lead to improved communication of ideas and findings. As children share their insights based on visual data representations, they develop not only math skills but also verbal skills and confidence. Ultimately, fostering an understanding of graphs is empowering, equipping young learners with the tools needed to navigate complex information systems in the future.


