Extra Challenge Graphs Worksheets for Ages 4-6
3 filtered results
-
From - To
Discover our engaging Extra Challenge Graphs Worksheets designed for children ages 4-6! These worksheets provide an exciting way for young learners to explore basic graphing concepts through colorful activities that stimulate critical thinking. Each worksheet introduces concepts like sorting, counting, and representing data visually, helping children develop essential math skills in a fun and interactive manner. Perfect for teachers and parents seeking to enhance their child’s learning experience, our worksheets can be used for at-home practice or in classroom settings. Watch as your child's confidence and understanding grow with this exciting math challenge tailored just for them!
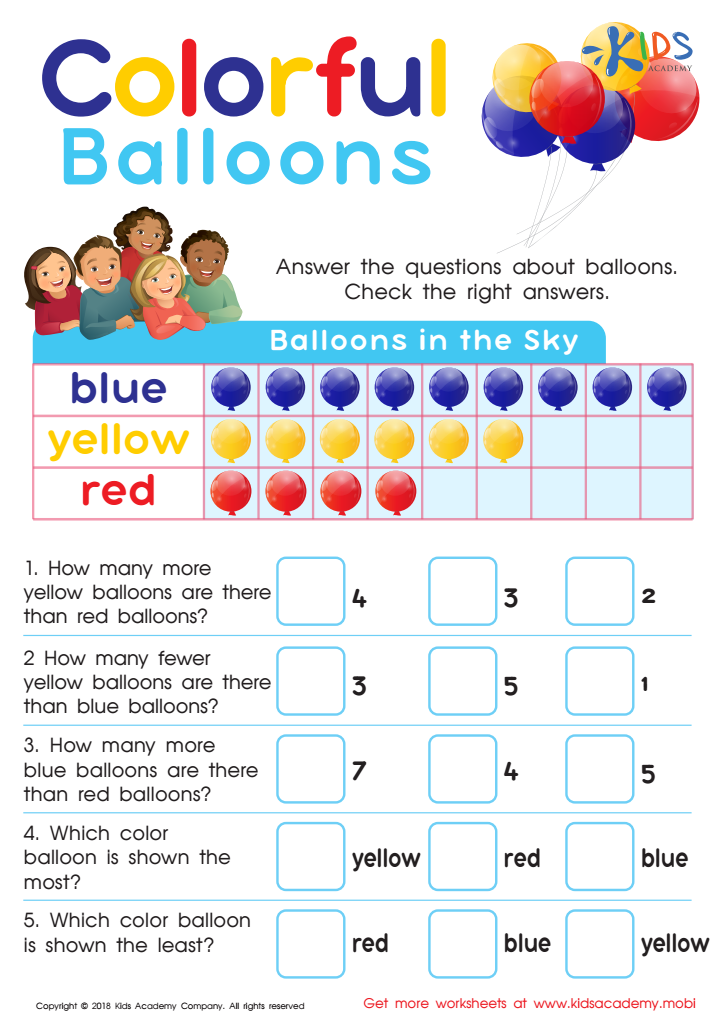
Picture Graphs: Colorful Balloons Worksheet
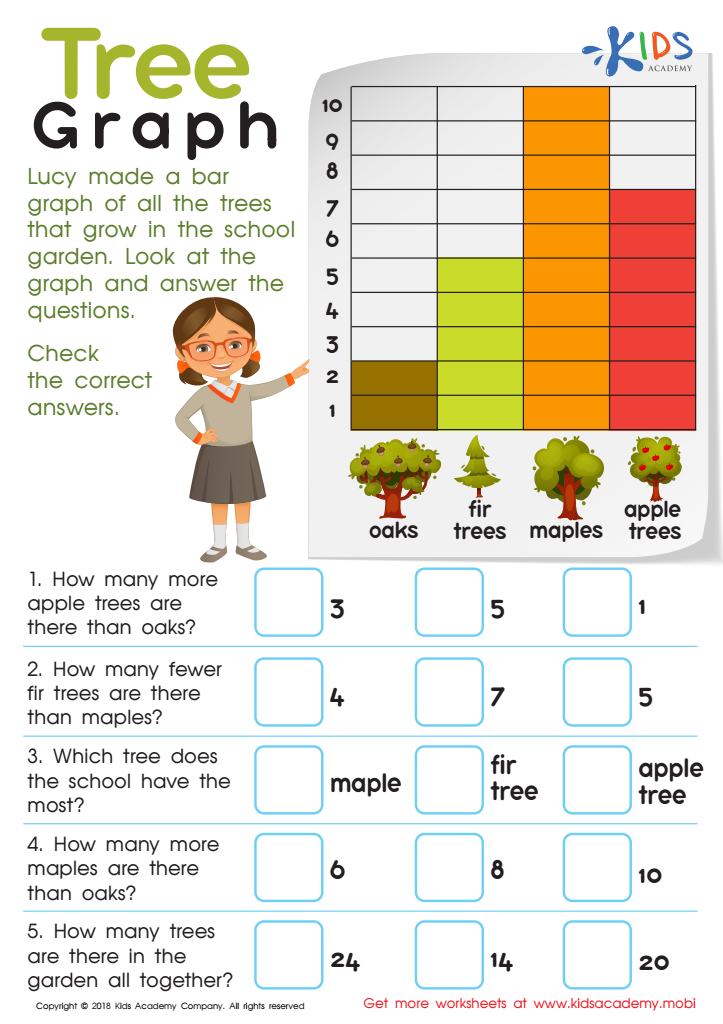
Tree Graph Worksheet

Match Tally Marks to Bar Graphs Worksheet


Extra Challenge Graphs for ages 4-6 are pivotal tools in early childhood education. They provide a structured yet flexible way for young learners to grasp complex concepts through visual representation. These graphs engage children in critical thinking and problem-solving, encouraging them to analyze information in an age-appropriate manner.
For parents and teachers, implementing Extra Challenge Graphs can advance skills in mathematics and literacy early on. These tools can be used to represent data from children’s daily activities or interests, fostering discussions around numbers, comparisons, and sequences. As children plot their experiences, they build foundational skills in organization, categorization, and interpretation, which are essential for academic success.
Moreover, Extra Challenge Graphs also teach children the value of persistence and resilience, as they work through challenges and visualize their learning journey. This process enhances self-regulation and promotes confidence, making learning both fun and impactful.
Involving parents in this process makes learning a collaborative and supportive experience, allowing them to engage in meaningful conversations with their children about growth and development. By utilizing Extra Challenge Graphs, educators and parents can help shape curious and competent lifelong learners who understand the power of data and visual information.


