Extra Challenge Graphs Worksheets for Ages 3-7
5 filtered results
-
From - To
Enhance your little ones' learning with our Extra Challenge Graphs Worksheets designed specifically for ages 3-7! These engaging worksheets are perfect for developing essential skills in data interpretation and graphing basics. Children will enjoy fun and interactive activities that introduce them to various types of graphs, including bar graphs and pictographs. Each worksheet is crafted to promote critical thinking and problem-solving skills while keeping young learners motivated and excited about math. Suitable for use in classrooms or at home, these worksheets are a fantastic way to foster early graph literacy in a stimulating and enjoyable way. Start your child's math adventure today!
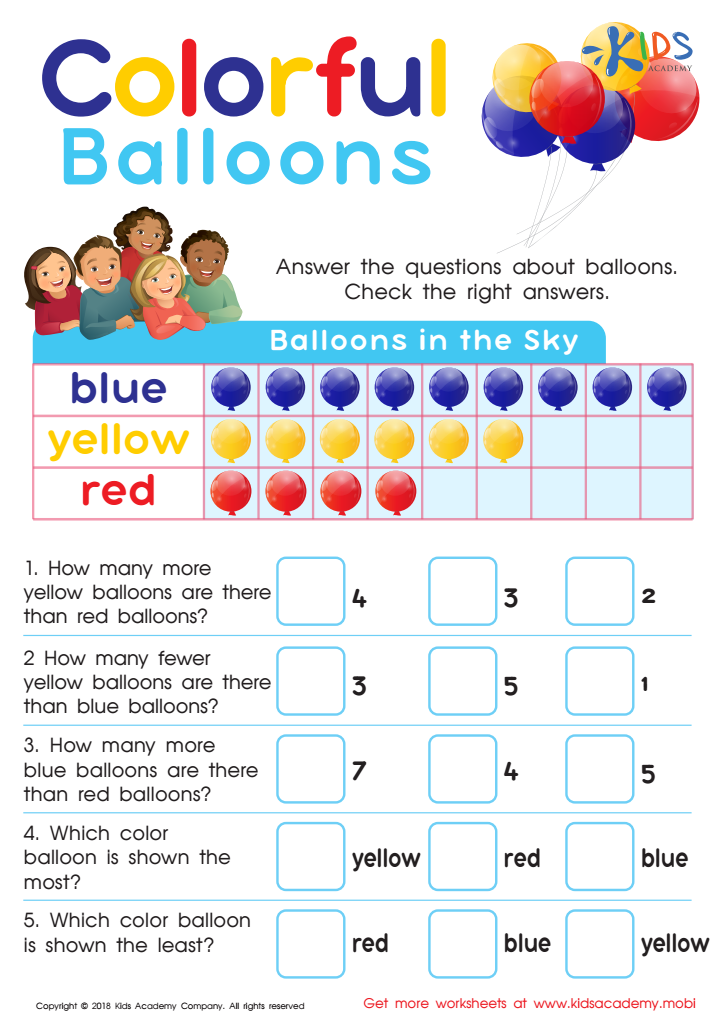
Picture Graphs: Colorful Balloons Worksheet
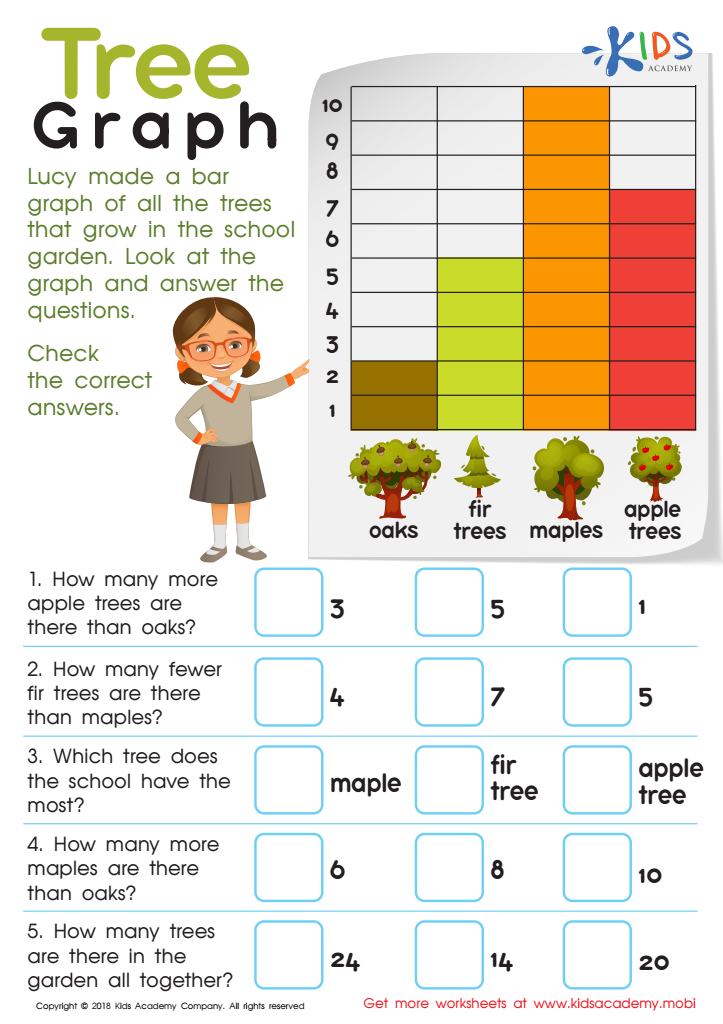
Tree Graph Worksheet

Match Tally Marks to Bar Graphs Worksheet
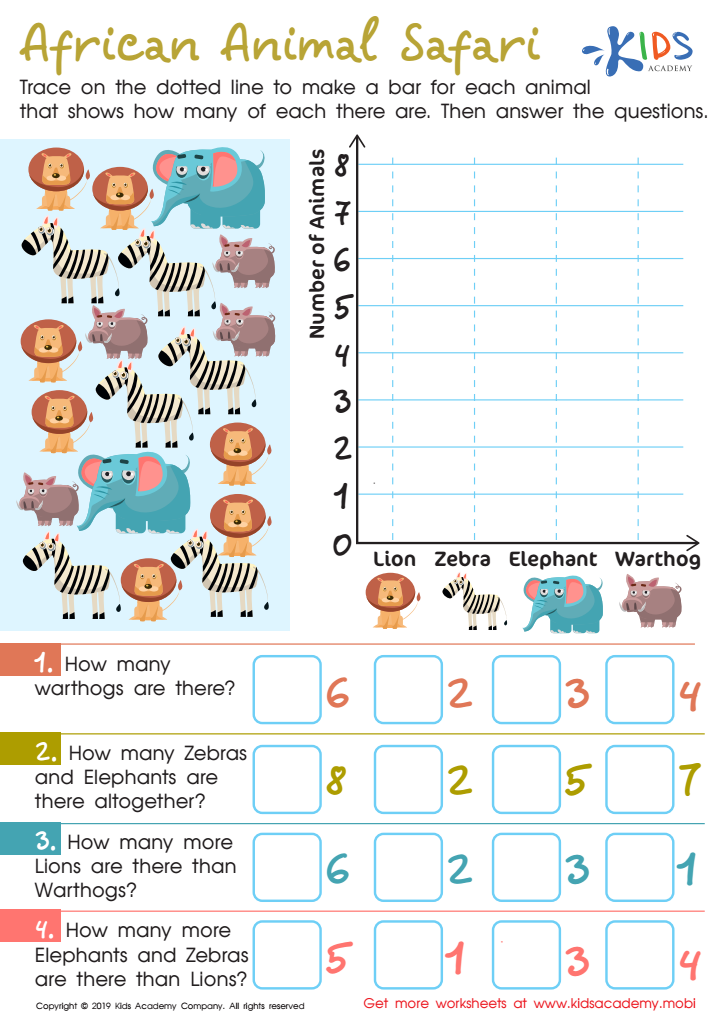
African Animal Safari Worksheet

Football Math Worksheet


Extra Challenge Graphs for ages 3-7 serve as an exceptional educational tool that can significantly enhance young learners' development. These graphs introduce essential concepts of data representation and interpretation in a playful and engaging manner. Parents and teachers should care about them for several important reasons.
Firstly, they encourage early mathematical thinking by helping children visualize relationships between different quantities. Through simple activities like sorting objects, categorizing favorites, or tracking daily weather, children are invited to think critically and make connections, laying a strong foundation for future math skills.
Furthermore, Extra Challenge Graphs foster collaborative learning. When parents or teachers engage in graphing activities with children, they promote social interaction and communication skills. This collaborative spirit boosts confidence and allows children to verbalize their thoughts, thus improving their language skills.
Moreover, these graphs encourage creativity and exploration. Children can express their own ideas and findings, which inherently promotes curiosity and a love for learning.
In an increasingly data-driven world, developing data literacy from an early age means equipping children with vital skills for the future. Therefore, embracing Extra Challenge Graphs is a valuable investment in cultivating analytical and problem-solving abilities in our youngest learners.


