3.MD.B.4 Measurement and Data worksheets for Grade 3
3 filtered results
Difficulty Level
Grade
Age
-
From - To
Subject
Activity
Standards
3.MD.B.4
Generate measurement data by measuring lengths using rulers marked with halves and fourths of an inch. Show the data by making a line plot, where the horizontal scale is marked off in appropriate units-whole numbers, halves, or quarters.
Popularity
Favorites
With answer key
Interactive
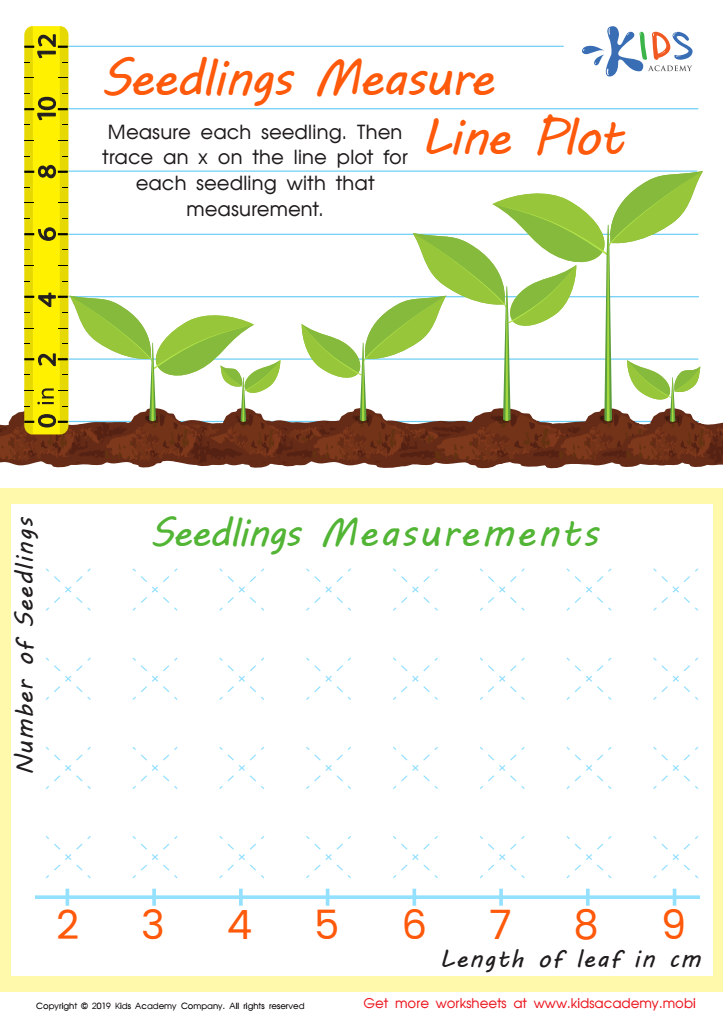

Seedling Measure Line Plot Worksheet
Help your kids adjust to learning line plots with this fun tracing sheet. Measure each seedling in the picture, then trace an x on the line plot for each one. Assist them in completing this easy exercise!
Seedling Measure Line Plot Worksheet
Worksheet
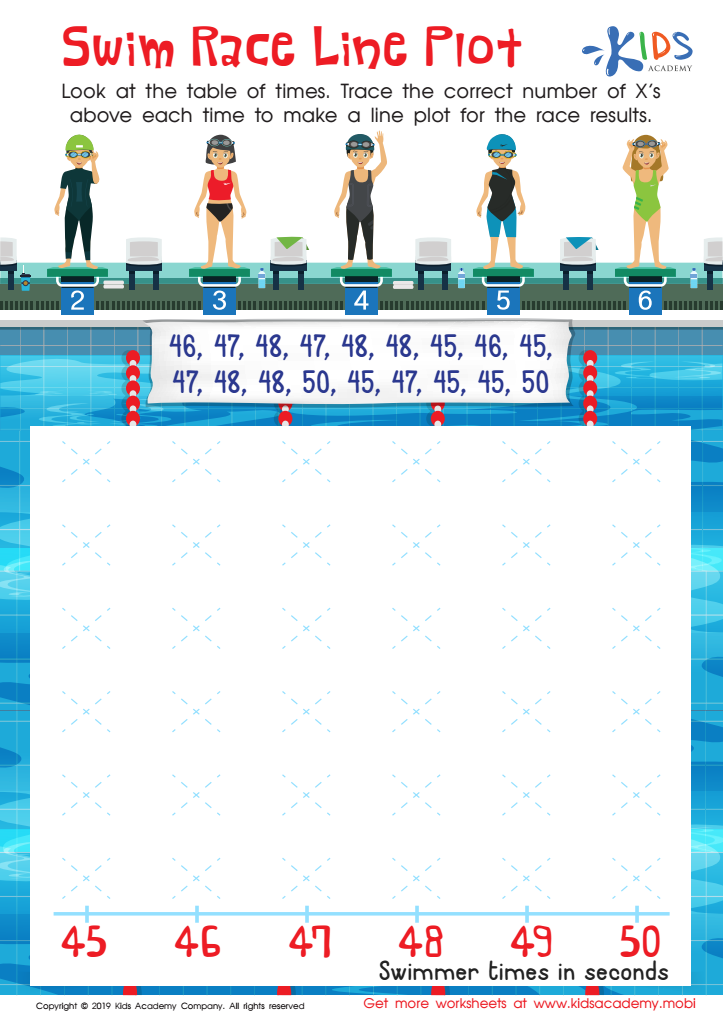

Swim Race Line Plot Worksheet
Kindergartners can benefit from extra help with math, particularly line plots. This worksheet can make the concept easier to understand. Together, study the table of times; then, guide the kids in tracing the correct number of x's above each time to make a line plot for the race result.
Swim Race Line Plot Worksheet
Worksheet
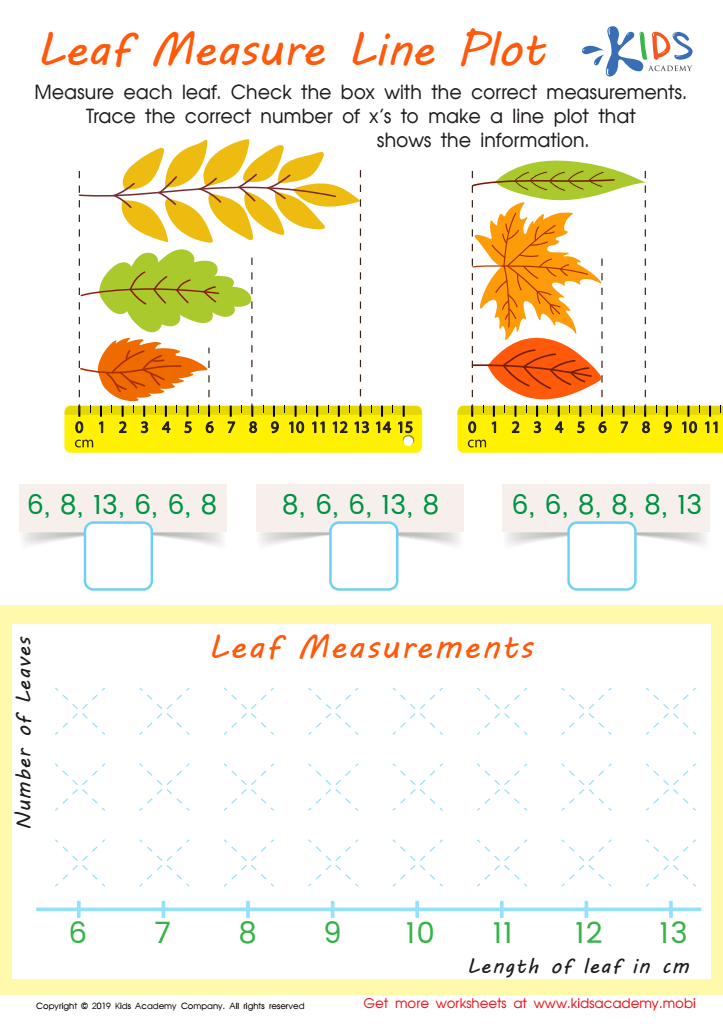

Leaf Measure Line Plot Worksheet
Help your third grader measure each of the four leaves, and check the box with the correct measurements. Then, trace the right number of x's to make a line plot showing the data. This exercise will engage your students and make it easier for them to grasp the concept of line plots.
Leaf Measure Line Plot Worksheet
Worksheet
 Assign to My Students


