2.MD.D.10 Measurement and Data worksheets for Grade 2
12 filtered results
Difficulty Level
Grade
Age
-
From - To
Subject
Activity
Standards
2.MD.D.10
Draw a picture graph and a bar graph (with single-unit scale) to represent a data set with up to four categories. Solve simple put-together, take-apart, and compare problems using information presented in a bar graph.
Popularity
Favorites
With answer key
Interactive

Taxi Math Worksheet
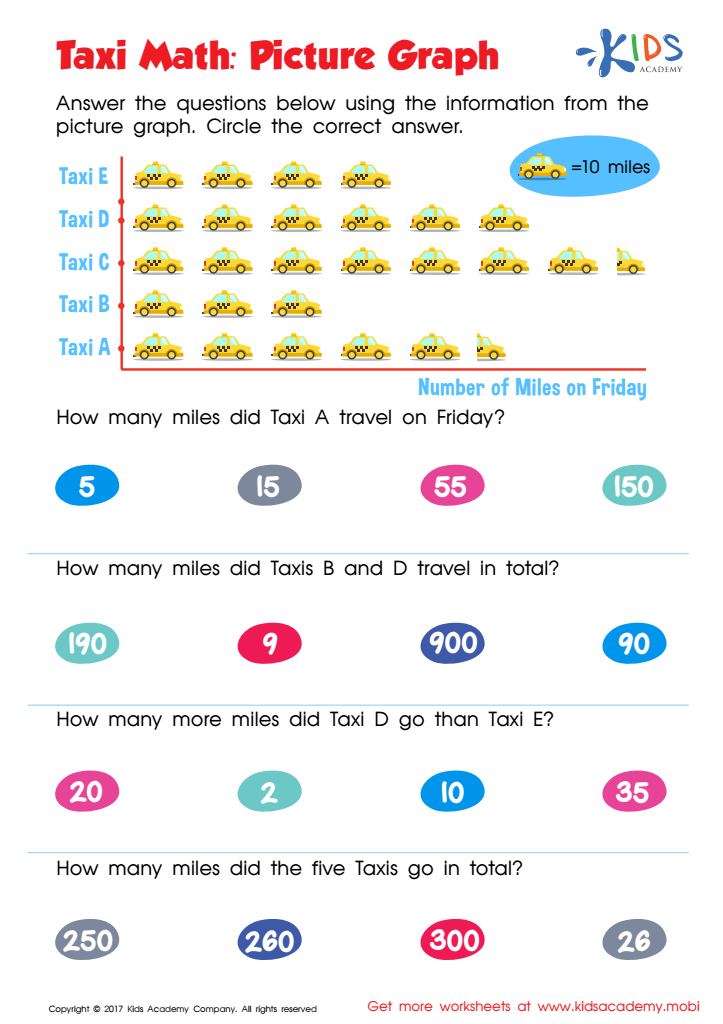
This 3rd grade worksheet helps kids learn data viz with fun taxis and colors to make the graph come alive. Picture graphs are an engaging way to teach data analysis, and this worksheet is the perfect tool!
Kids love picture graphs! This 3rd grade worksheet uses colorful taxis to help them learn to read graphs better. Each image represents a number, teaching data analysis with visuals and fun. An engaging way to learn data viz, this worksheet is perfect for young learners.
Taxi Math Worksheet
Worksheet

Park Math: Bar Graph Worksheet
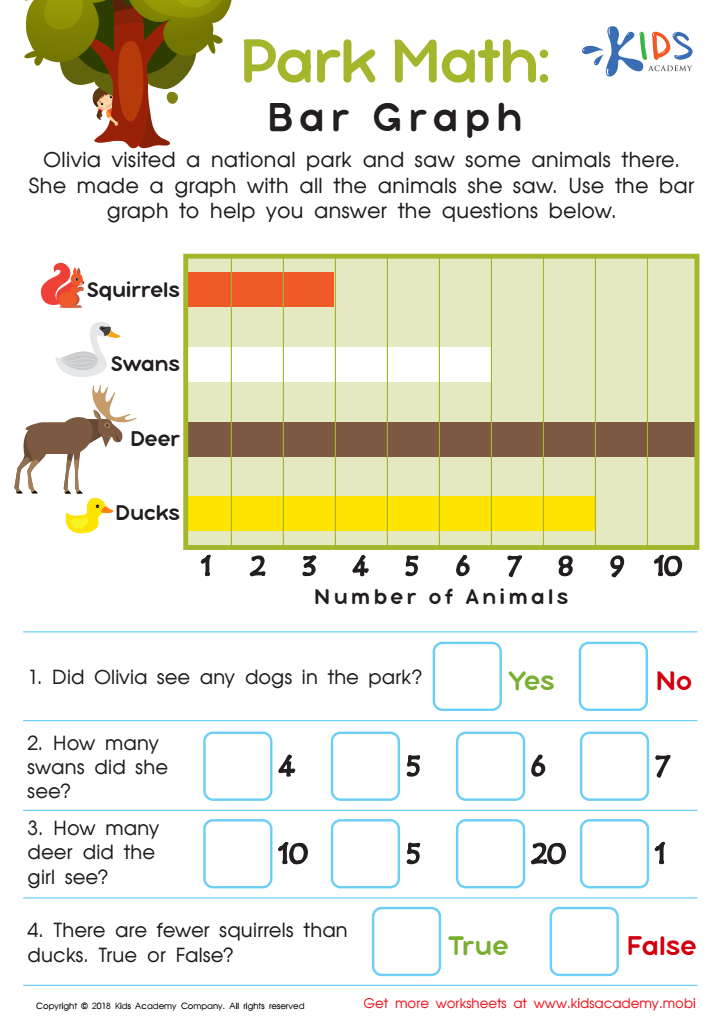
Do your children love the park? Ask them to tell you some of their favorite animals. Then, have them look at Olivia's graph. She visited a National Park and recorded all the animals she saw. Use the graph to answer the questions given.
Park Math: Bar Graph Worksheet
Worksheet

Ticket for the Train Worksheet
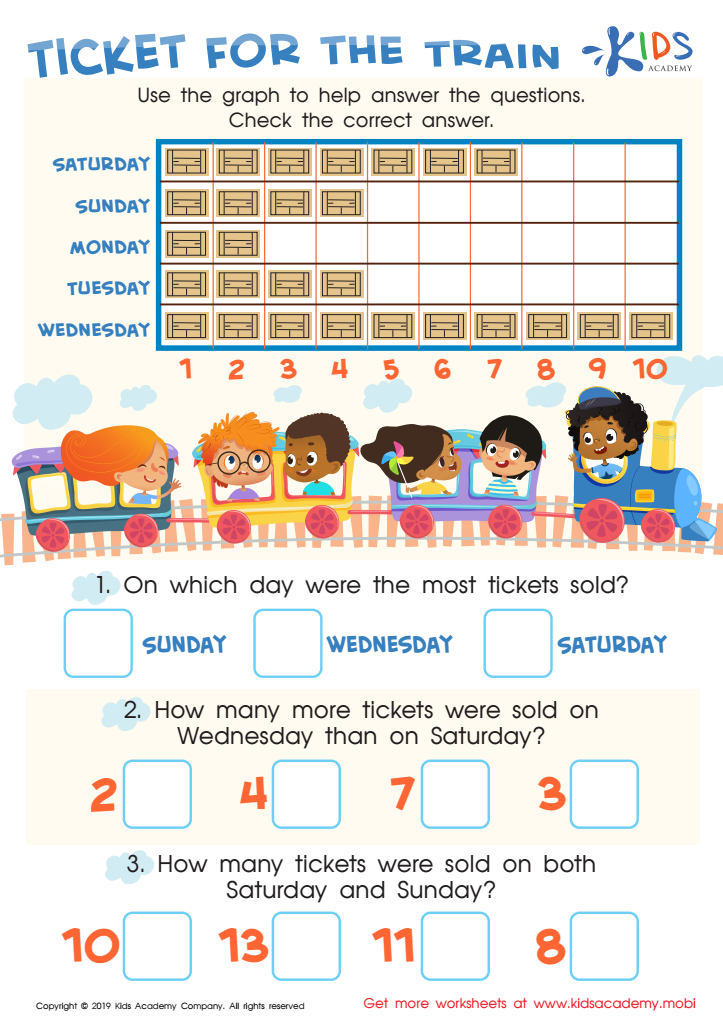
It's important to use fun scenarios with familiar objects when teaching kids. Try discussing train rides and the accompanying picture graph. Ask questions about it, then help kids check the correct answers. Let them enjoy the learning process!
Ticket for the Train Worksheet
Worksheet

Coffeehouse Survey: Picture Graph Word Problems Worksheet
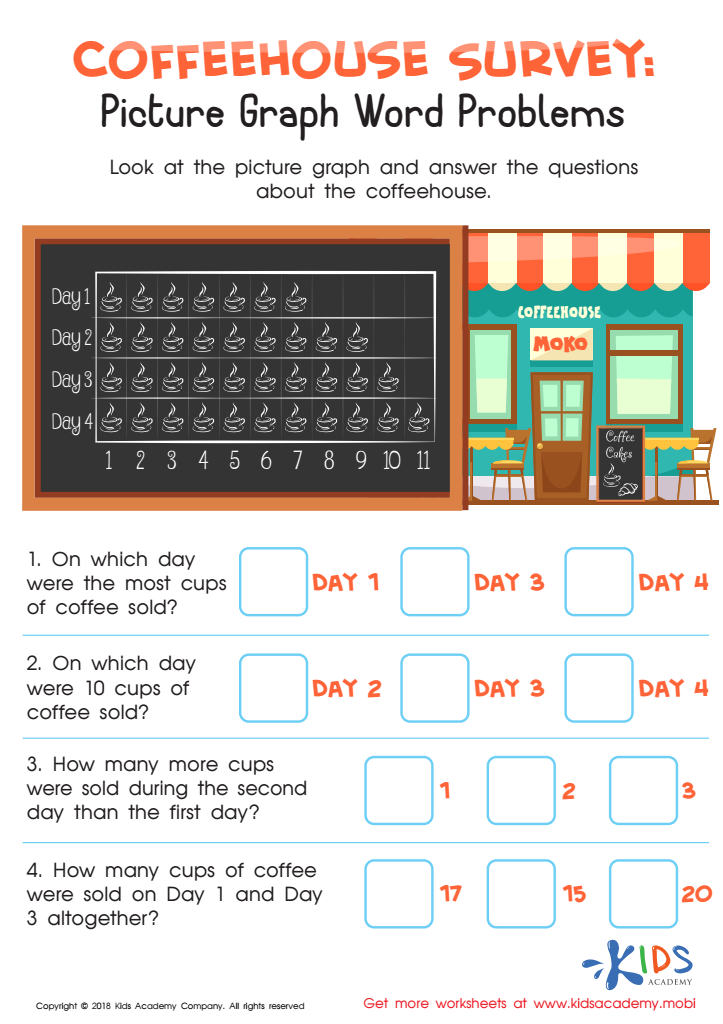
This coffeehouse survey helps children interpret pictures and answer questions. Your child will look at a picture graph displaying daily coffee cup sales from Day 1 to Day 4. Aid them in answering questions on the number of cups sold and which day had the most sales.
Coffeehouse Survey: Picture Graph Word Problems Worksheet
Worksheet
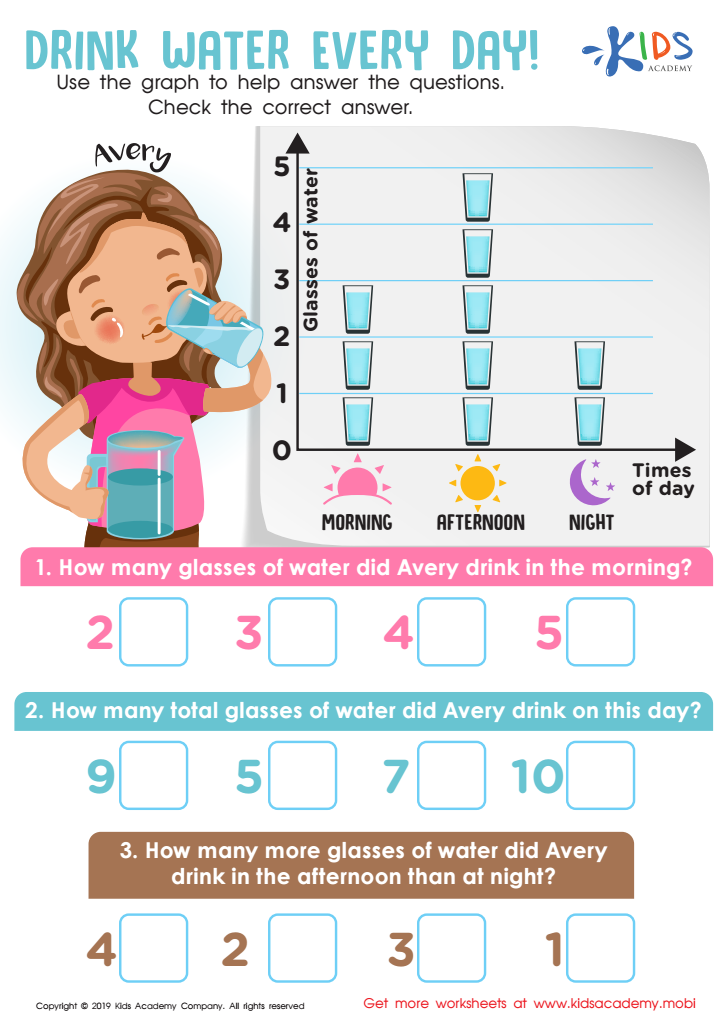

Drink Water Every Day! Worksheet
Water is essential for life. Without it, all living things would die eventually. Drinking it regularly is key to our survival. Help your kids understand the importance of water by looking at the graph in the worksheet together, and help them answer the questions it contains.
Drink Water Every Day! Worksheet
Worksheet
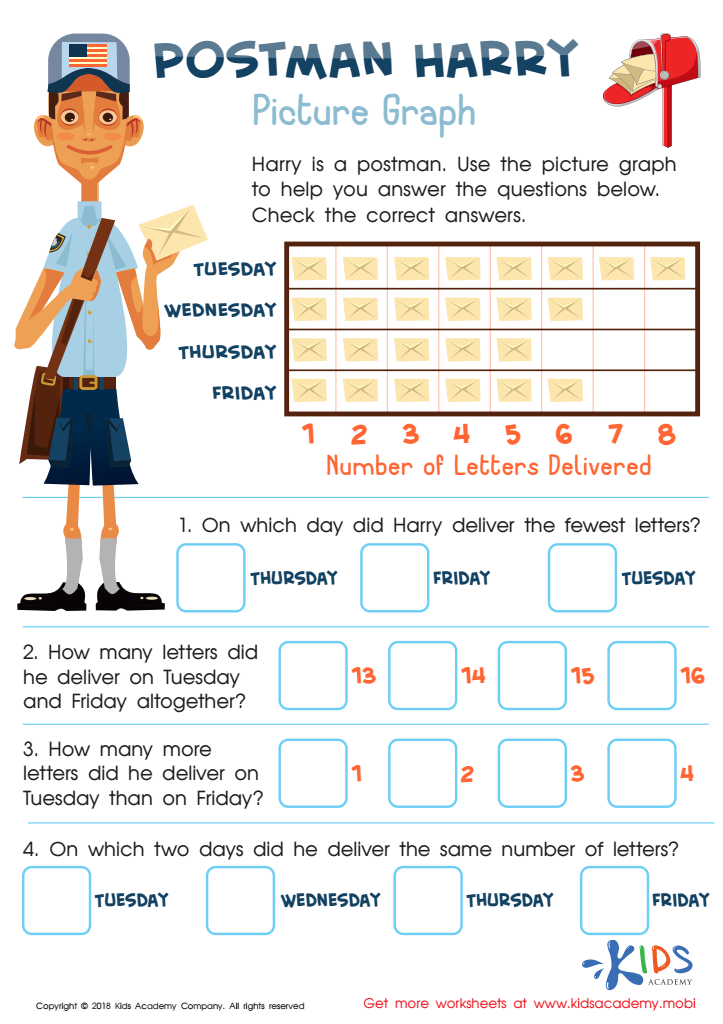

Postman Harry: Picture Graph Worksheet
Show your kids a picture of Harry the Postman and ask if they can identify his profession. Then, with this simple picture graph worksheet, help Harry out by having your kids answer the questions below the picture graph. It shows the number of letters he delivered, and on what day. Get your kids to use the picture graph to solve it.
Postman Harry: Picture Graph Worksheet
Worksheet
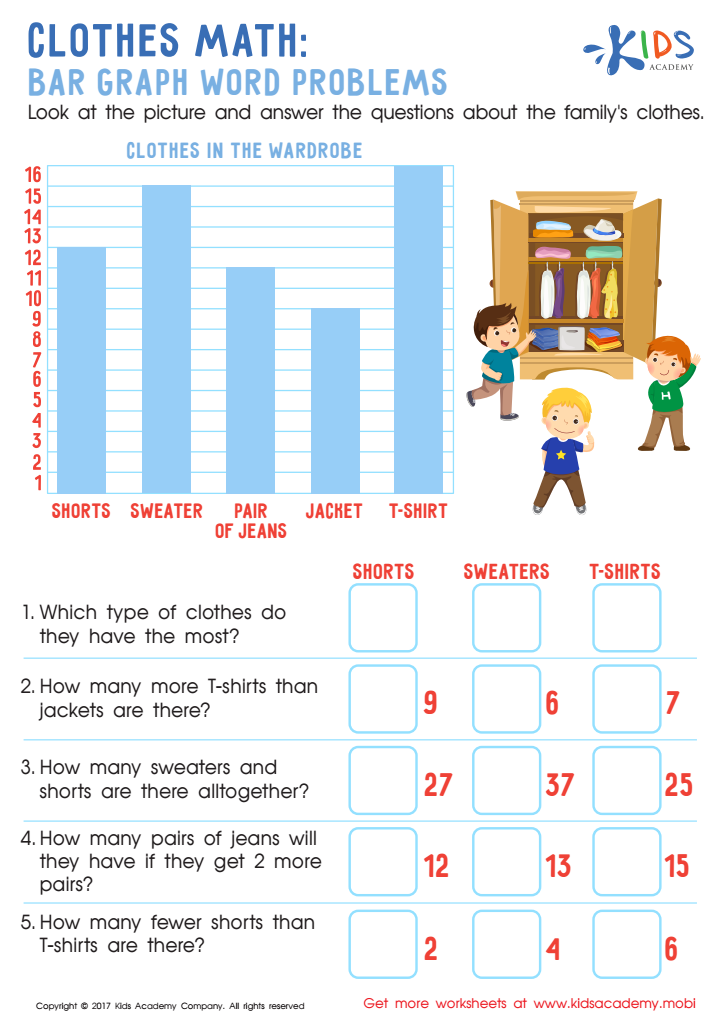

Clothes Math: Bar Graph Word Problems Worksheet
Introduce your kids to a family like theirs with this worksheet. They'll look at the picture of three children in front of a wardrobe and the graph of clothes inside. Ask them questions about the number of items like jeans, sweaters, shorts, jackets, and t-shirts. Let them explore their understanding of counting and family similarity.
Clothes Math: Bar Graph Word Problems Worksheet
Worksheet
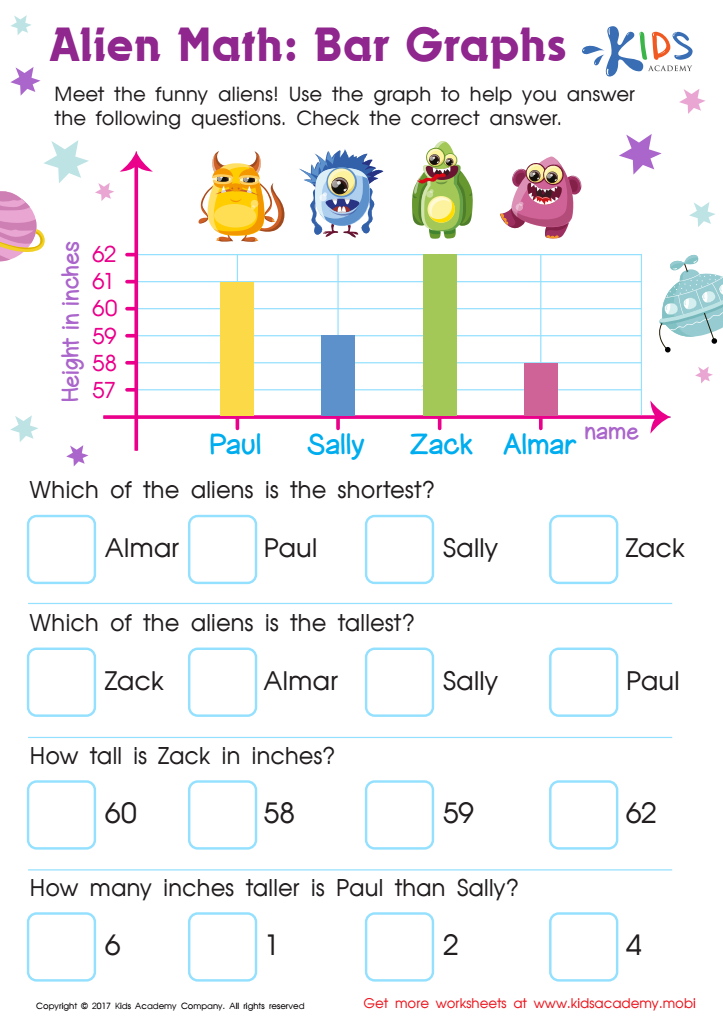

Bar Graphs Worksheet
Let's blast off to outer space and visit our funny alien friends with this bar graphs worksheet PDF! Kids gain valuable measurement and data analysis skills by comparing sizes of the aliens and working with bar graphs.
Bar Graphs Worksheet
Worksheet
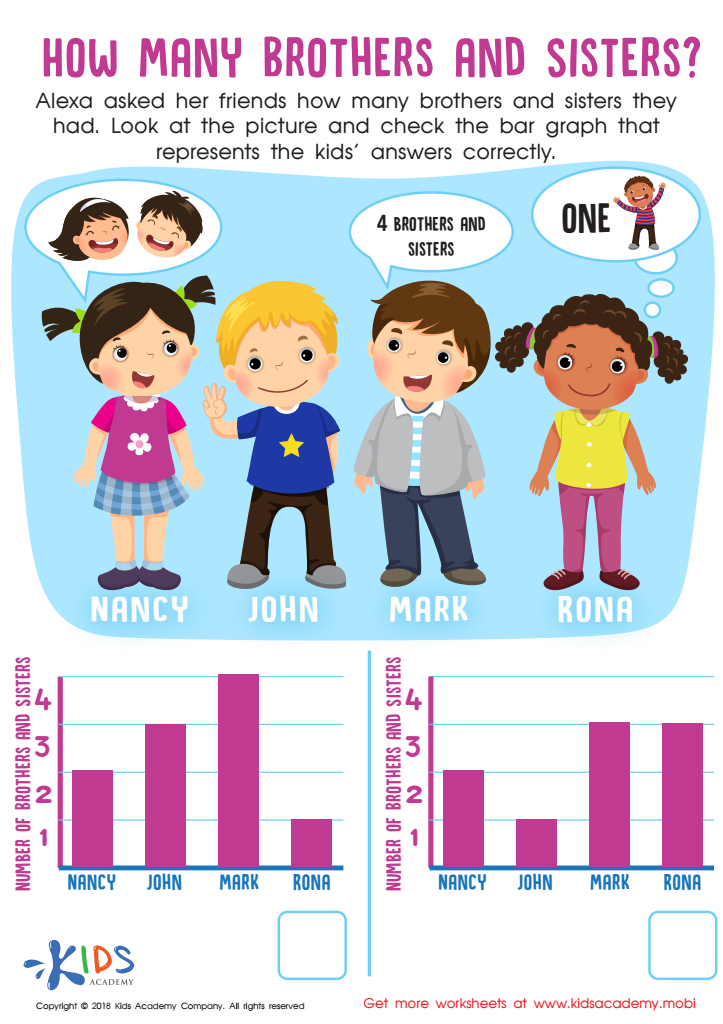

How Many Brothers and Sisters? Worksheet
With this worksheet, Alexa has asked her friends how many siblings they have. Have your child look at the picture and use it to answer the bar graph correctly. Can they tell you how many siblings their friends have? See if they can get it right!
How Many Brothers and Sisters? Worksheet
Worksheet
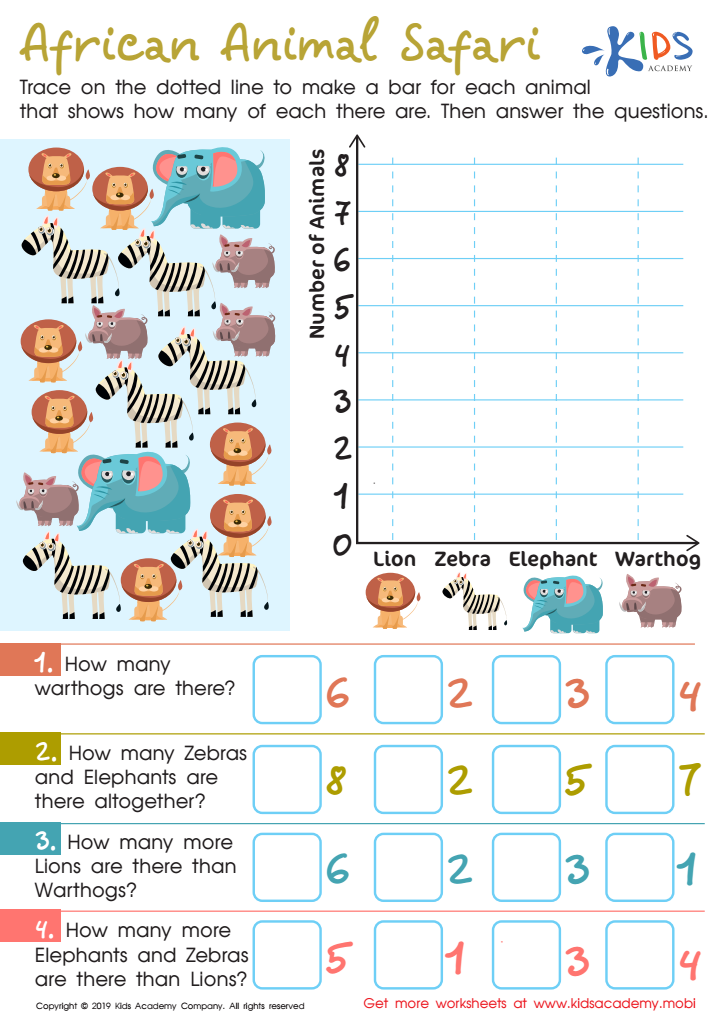

African Animal Safari Worksheet
Help students learn geography and math, with this worksheet. Examine the graph and ask your students questions. Have them answer using the graph and addition/subtraction exercises. This can help them name continents, countries, and animals unique to each.
African Animal Safari Worksheet
Worksheet
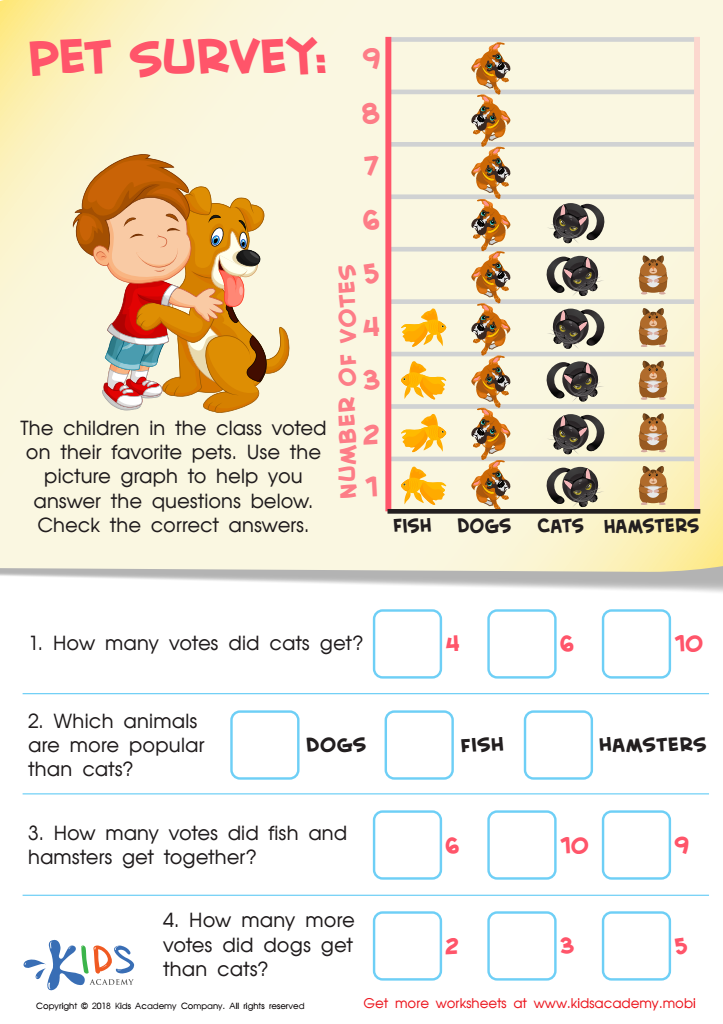

Pet Survey Worksheet
Do you have a furry family member? If the answer is yes and your kids love animals, they'll enjoy this worksheet. The picture graph shows the children's votes for their favorite pet - fish, dog, cat and hamster. Ask your child to use the graph to answer the questions. Guide them to check the right answer.
Pet Survey Worksheet
Worksheet
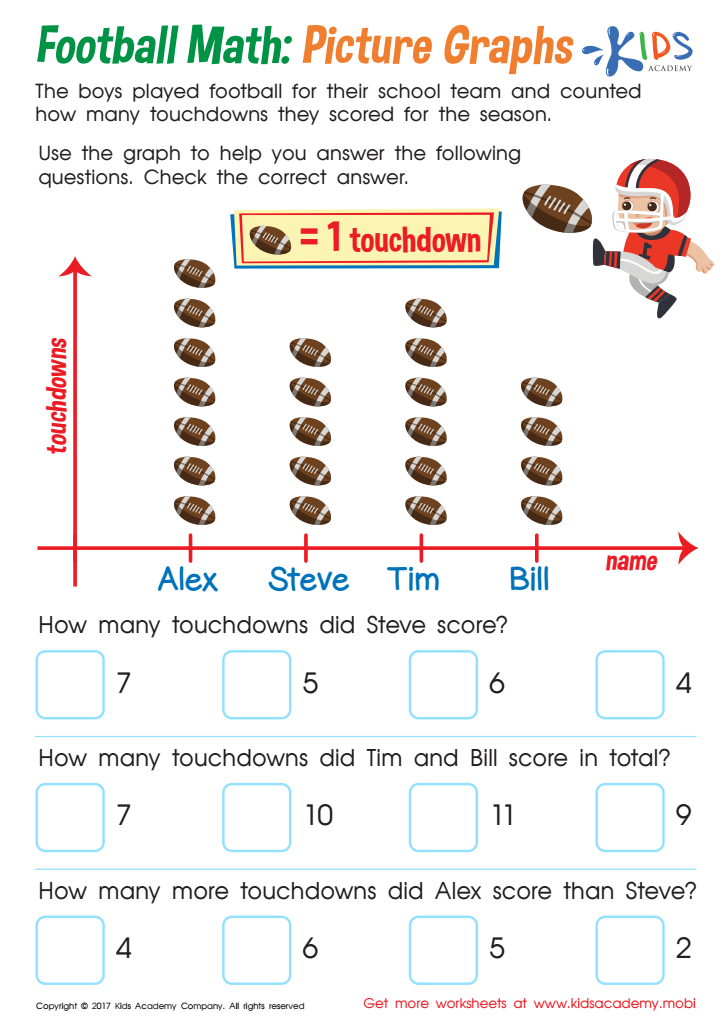

Football Math Worksheet
It uses football-themed data to compare teammates' touchdowns. Perfect for motivating your child and helping them learn to read graphs in a fun way!
Motivate your child to learn to read graphs with this fun and sporty picture graph worksheet! Football-themed data is used to compare teammates and their touchdowns, sure to delight your little sports fan. Perfect for teaching data analysis in an engaging way!
Football Math Worksheet
Worksheet
 Assign to My Students


