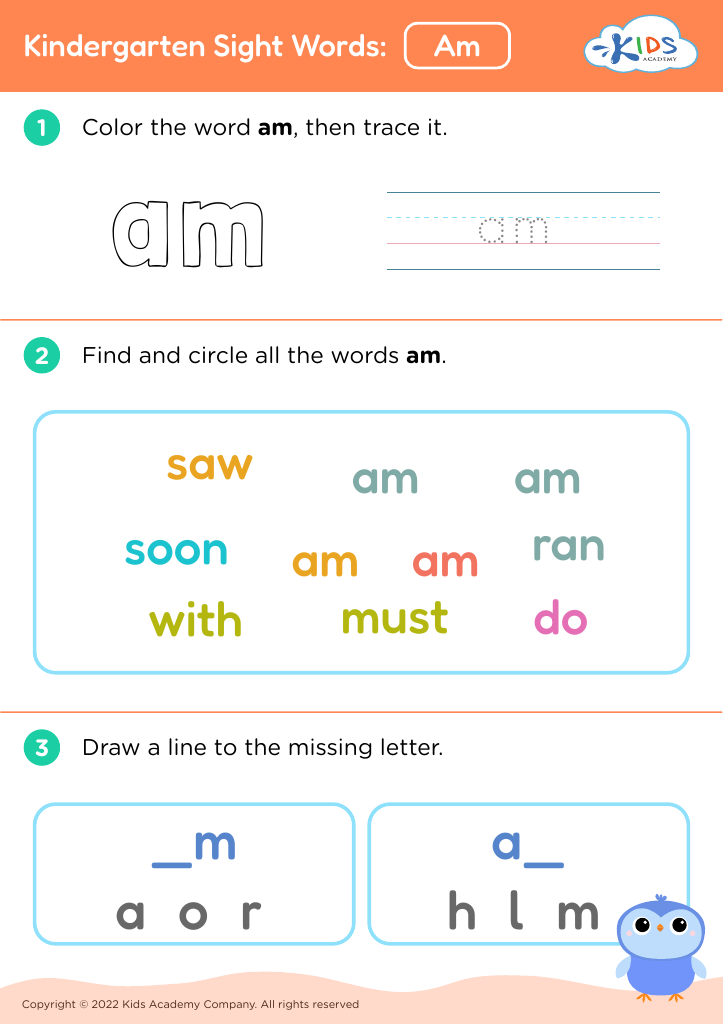
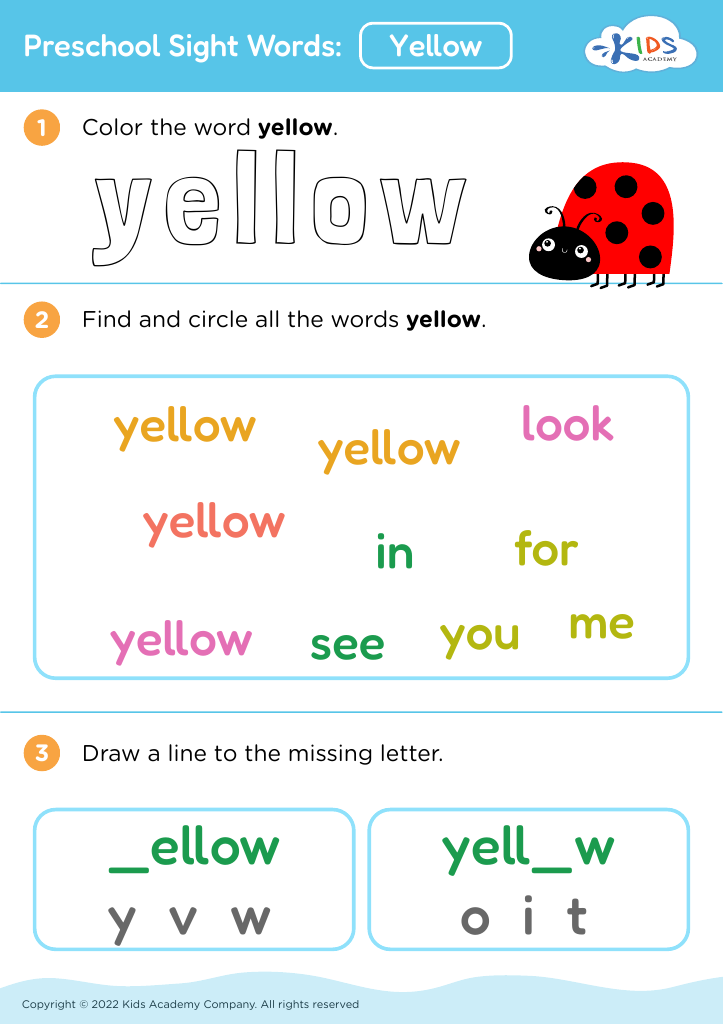
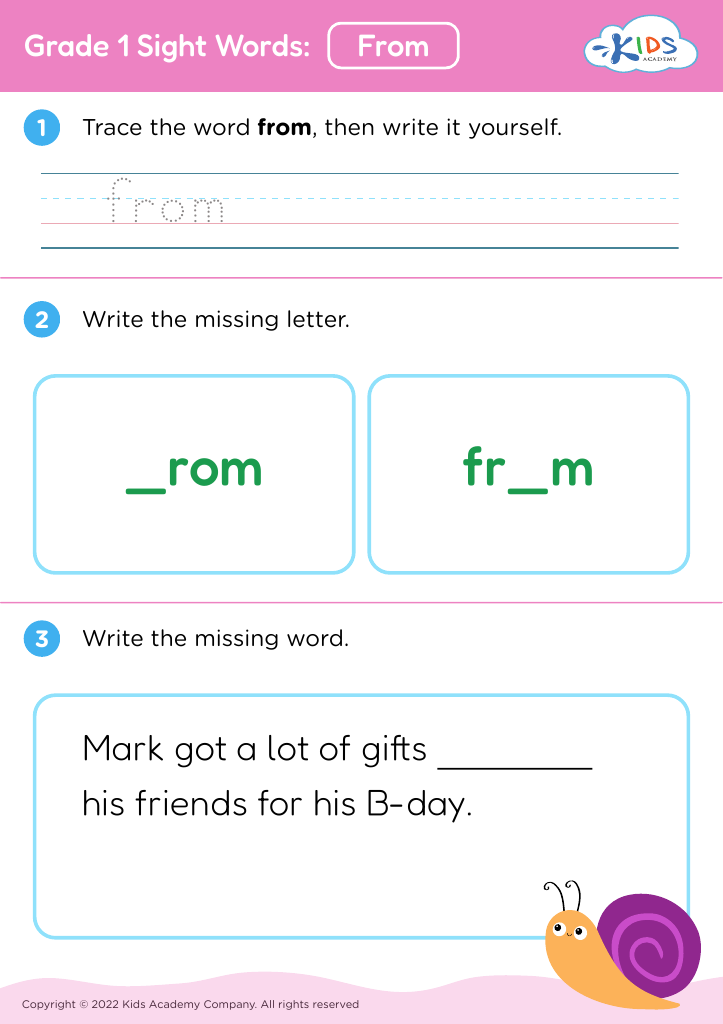
Understanding bar graphs Worksheets for Ages 3-6
3 filtered results
-
From - To
Help your little ones grasp the fundamentals of bar graphs with our engaging worksheets designed for ages 3-6. These activities introduce young learners to the concept of data visualization in a fun and accessible manner. Each worksheet encourages children to interpret simple bar graphs, compare quantities, and understand basic data representation. With colorful illustrations and interactive tasks, kids will develop essential math skills, improve their critical thinking abilities, and cultivate a love for learning. Ideal for classroom use or at-home activities, our understanding bar graphs worksheets create a solid foundation for future mathematical success. Explore the excitement of numbers today!


Understanding bar graphs is a crucial skill for children aged 3-6 as it lays the foundation for essential math and analytical skills. Young learners are naturally curious thinkers; introducing them to bar graphs at this stage nurtures their ability to interpret and visualize data effectively. Engaging with bar graphs helps children grasp concepts such as comparison, patterns, and quantities in a fun and interactive manner, making learning enjoyable.
Parents and teachers should care because early exposure to these graphical representations encourages critical thinking and problem-solving abilities. It enables children to express their thoughts visually and enhances their communication skills. This knowledge is also invaluable in everyday situations as it helps children process information in their environment, such as comparing the number of apples to bananas or favorite colors among friends.
Additionally, exploring bar graphs promotes collaboration when children work in groups, fostering essential social skills. Overall, understanding bar graphs fine-tunes cognitive development, setting the stage for more advanced mathematical concepts in later schooling, while building a child’s confidence in dealing with numbers and data from an early age. Investing time in these foundational skills prepares children for future academic success.


