Analyzing data Graphs Worksheets for Ages 3-9
5 filtered results
-
From - To
At Kids Academy, our Analyzing Data Graphs Worksheets for ages 3-9 equip young learners with essential math skills through engaging and interactive activities. Each worksheet is designed to help children comprehend and interpret various types of graphs like bar charts and pictograms. Whether they're counting objects, comparing quantities, or making simple predictions, these worksheets nurture analytical thinking and problem-solving abilities. Tailored to align with early childhood educational standards, our resources foster confidence in understanding basic data. Ideal for classroom or home learning, these graph worksheets make mastering math both fun and educational! Discover a world of learning with Kids Academy.

Recycling Picture Graph Worksheet

Planets Bar Graph Worksheet
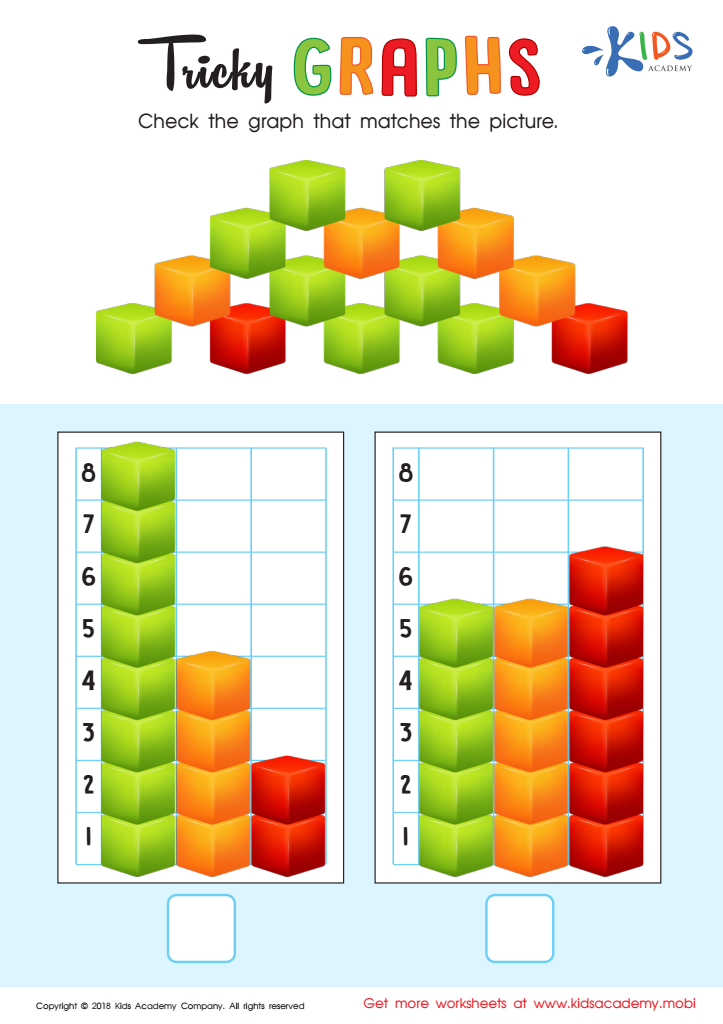
Tricky Graphs Worksheet
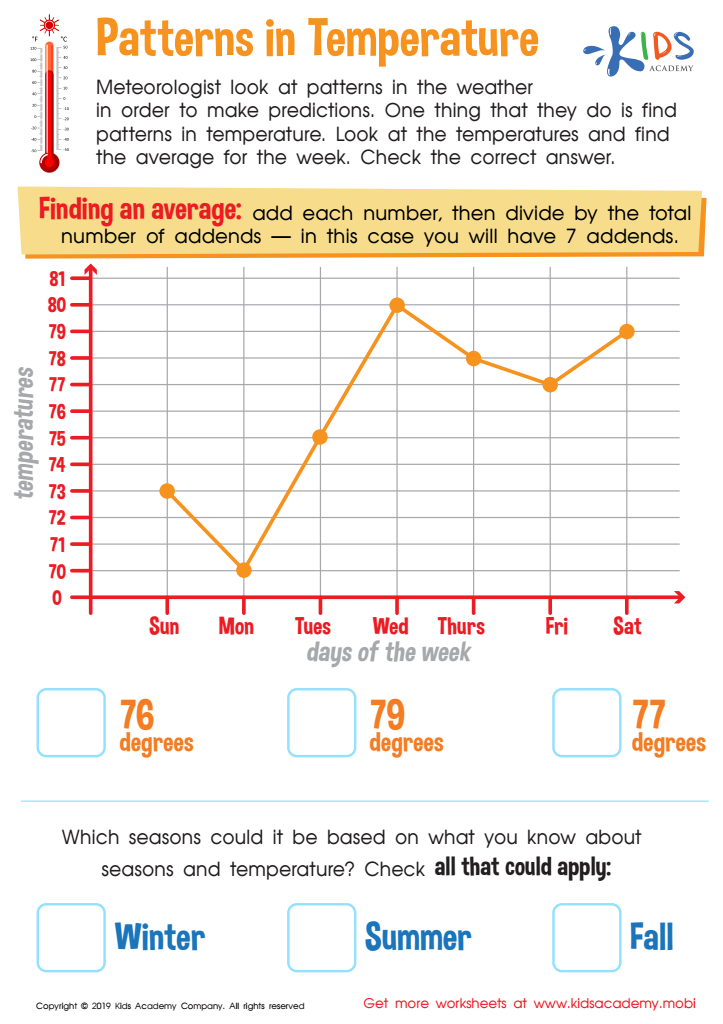
Patterns in Temperature Worksheet

Egyptian Bar Graph Worksheet


Parents and teachers should greatly value the skill of analyzing data graphs in young children, ages 3-9, because it forms a foundational aspect of their cognitive and analytical development. Introducing data analysis at an early age cultivates critical thinking and problem-solving skills, which are essential in all areas of learning. By interpreting graphs, children begin to understand patterns, relationships, and trends within information—a critical component of literacy in the information age.
Moreover, graph analysis fosters a child's ability to interpret quantitative information, reinforcing math skills in a tangible and interactive way. Graphs represent data visually, making abstract numbers more comprehensible and engaging for young minds. This hands-on interaction with numbers encourages enthusiasm for math and helps in breaking down the fear often associated with it.
Additionally, incorporating data graphs into the curriculum supports scientific inquiry and curiosity. When children collect their own data and represent it graphically, they learn the scientific method’s first steps—observation and measurement.
Early exposure to graph interpretation also boosts communication skills. Children learn to articulate their understanding of graphs, which promotes vocabulary growth and the ability to express complex ideas clearly.
In summary, analyzing data graphs in early childhood supports a multifaceted development platform that enhances critical thinking, math literacy, scientific inquiry, and communication skills.


