
Graph interpretation Math Worksheets for Ages 3-9
4 filtered results
Difficulty Level
Grade
Age
-
From - To
Subject
Activity
Standards
Discover our engaging Graph Interpretation Math Worksheets designed specifically for children ages 3-9! These worksheets help young learners develop essential math skills by interpreting data through colorful and interactive graphs. With a variety of activities tailored to different learning levels, kids will enjoy exploring concepts such as bar graphs, pictographs, and line plots. These worksheets encourage critical thinking and boost analytical skills while making learning fun. Perfect for home practice or in the classroom, our resources support early math education and preparation for more advanced concepts. Start fostering your child’s love for math today with our exciting graph interpretation worksheets!
Favorites
With answer key
Interactive

Taxi Math Worksheet
This 3rd grade worksheet helps kids learn data viz with fun taxis and colors to make the graph come alive. Picture graphs are an engaging way to teach data analysis, and this worksheet is the perfect tool!
Kids love picture graphs! This 3rd grade worksheet uses colorful taxis to help them learn to read graphs better. Each image represents a number, teaching data analysis with visuals and fun. An engaging way to learn data viz, this worksheet is perfect for young learners.
Taxi Math Worksheet
Worksheet
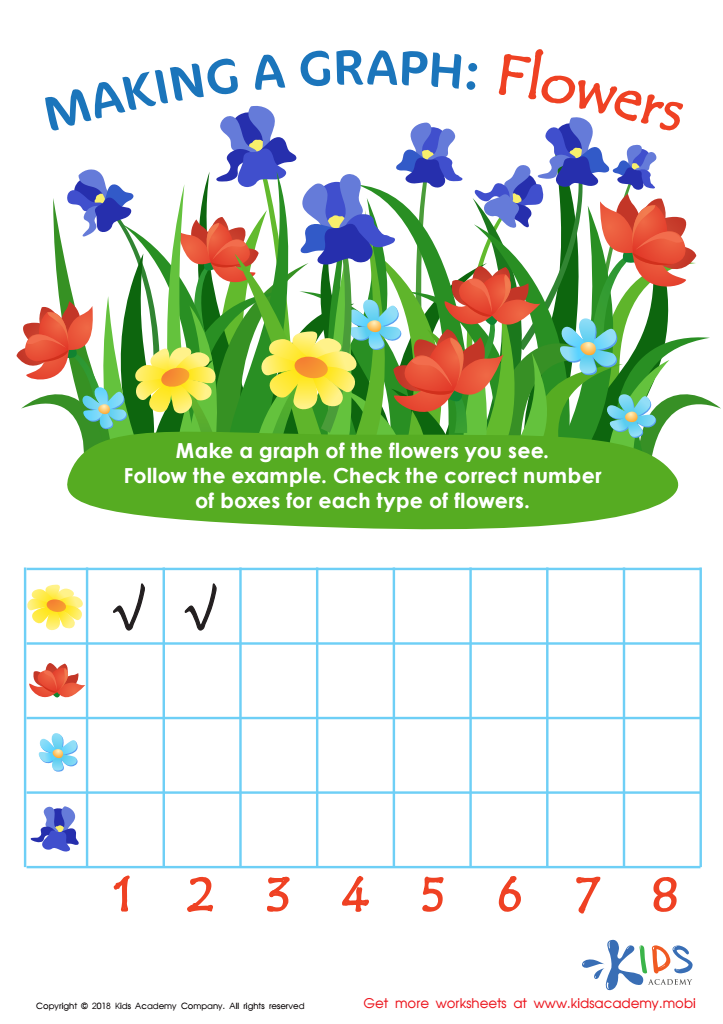
Making a Graph: Flowers Worksheet
Kids will love this engaging PDF graph. They'll count flowers and use checkmarks to represent the number on the graph, tangibly seeing the differences in an organized way they contributed to. All while developing their number representation and concrete number sense skills without even realizing it!
Making a Graph: Flowers Worksheet
Worksheet

Graph: Baby Animals Worksheet
Graphs are essential for learning in math, science and ELA. This worksheet featuring baby animals is a fun way to practice reading graphs. Look at the graph and answer the questions below it. Check the boxes for the right answers based on the data.
Graph: Baby Animals Worksheet
Worksheet
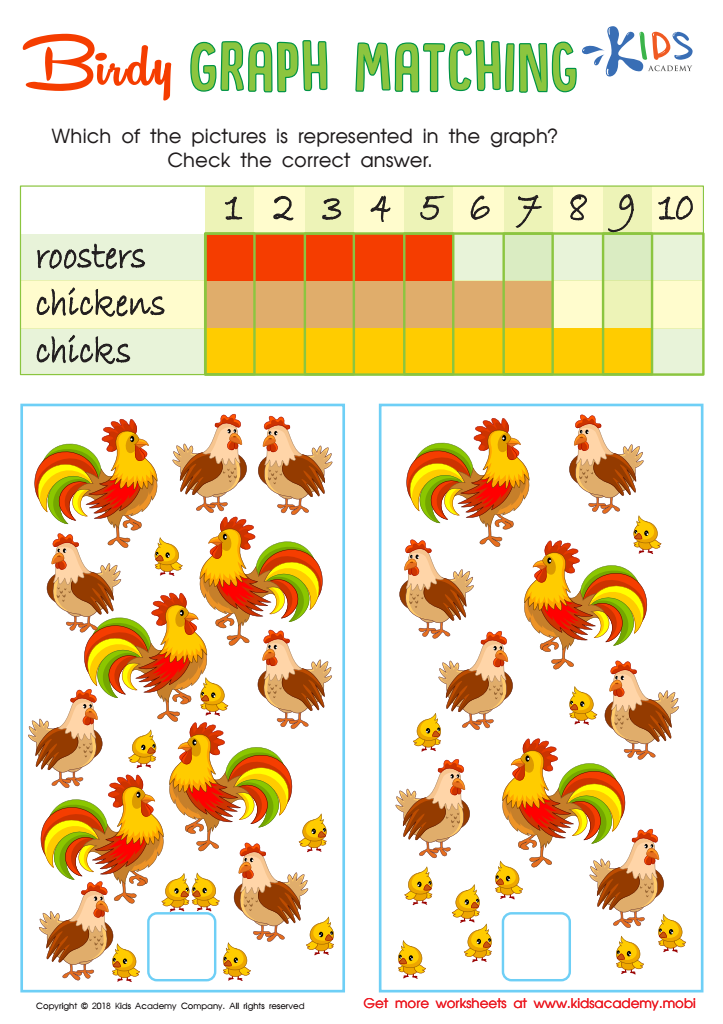
Birdy Graph Matching Worksheet
Treat your little one to a fun worksheet to practice visual discrimination, counting, graphing and tallying! They will sort the birds, count and assign values and use graph reading to answer the questions. They'll be so busy enjoying the counting that they won't even realize they are honing their skills!
Birdy Graph Matching Worksheet
Worksheet
Join Kids Academy for Free
Who is primarily going to use this learning content?


Graph interpretation is an essential math skill for children aged 3-9, and both parents and teachers should prioritize its importance. At this developmental stage, children are beginning to explore and understand their environment. Graphs encourage them to visualize data, making abstract concepts more concrete and accessible. Engaging with graphs fosters critical thinking, enabling young learners to analyze information, identify patterns, and draw conclusions based on what they see.
Understanding graphs also supports the development of early numeracy skills, as children learn to associate quantity with visual representations. It promotes skills such as sorting, comparing, and organizing information, which are foundational for more advanced mathematical concepts. Furthermore, graph interpretation bolsters language skills, as children learn to articulate their observations and reasonings.
In addition, early exposure to graphs prepares children for real-world situations. As they grow, children will encounter graphs in various contexts—be it in school reports, news articles, or everyday scenarios like weather forecasts. By nurturing these skills early on, parents and teachers pave the way for effective decision-making and informed citizenship. Ultimately, graph interpretation helps children become critical thinkers who can navigate and make sense of the data-driven world around them.


