Understanding graphs Worksheets for Ages 4-6
3 filtered results
-
From - To
Foster early graphing skills with our "Understanding Graphs Worksheets for Ages 4-6". Designed to develop young learners’ abilities to interpret and create basic graphs, these engaging worksheets blend colorful visuals with hands-on activities. Children will practice sorting, counting, and comparing data, providing a fun introduction to early math concepts. Perfect for kindergarten and first-grade students, these worksheets help build a solid foundation in analytical thinking and data comprehension. Download today to make learning graphs a joyful experience for your little ones, nurturing critical skills that will support their future academic success. Enhance classroom learning or enjoy at home!

Making a Graph: Creepy Crawlies Worksheet
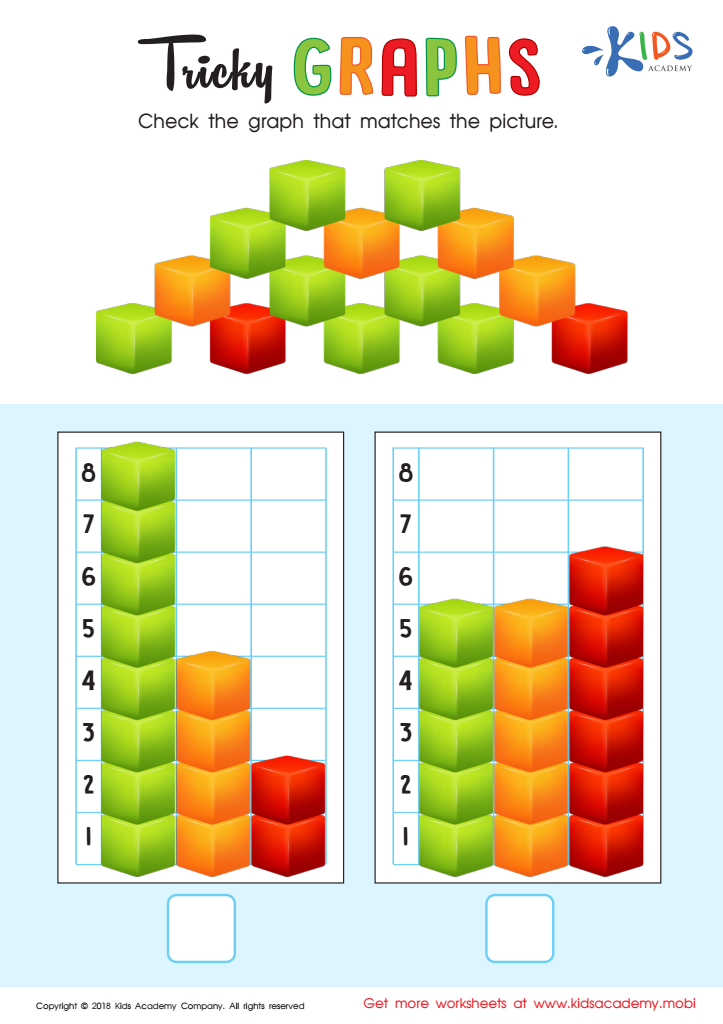
Tricky Graphs Worksheet

Match Tally Marks to Bar Graphs Worksheet


Understanding graphs at an early age, especially for children between 4-6 years old, is fundamental for developing essential cognitive and analytical skills. Graphs provide a visual representation of data, which helps children understand and interpret information more readily than through text alone. By introducing children to basic graphs like bar charts, pictographs, or simple line graphs, we lay the foundation for critical thinking and data literacy.
Early exposure to graphs can also enhance a child's ability to compare quantities, recognize patterns, and draw conclusions, which are vital skills in both mathematics and science. For instance, children can easily grasp the concept of "more” or "less" when they see objects distinctly aligned in a bar graph. This visual and interactive aspect fosters engagement and retention far better than oral or written lessons alone.
Additionally, graphs are ubiquitous in everyday life, from weather forecasts to school reports and beyond. Enabling children to interpret these visual aids early on prepares them for future academic challenges. Parents and teachers should aim to incorporate simple graphing activities, using objects familiar to children, like toys or fruits, in both playful and educational contexts. Cultivating these skills early not only makes learning fun but also equips children with tools for effective problem-solving and informed decision-making.


