Understanding graphs Worksheets for Ages 5-9
6 filtered results
-
From - To
Unlock the world of graphs with our "Understanding Graphs Worksheets" designed specifically for children ages 5-9. These engaging resources introduce key concepts such as bar graphs, pictograms, and line plots through fun and interactive activities. Tailored to enhance critical thinking and analytical skills, our worksheets feature vibrant visuals and relatable examples that make learning enjoyable. Kids will love organizing data, interpreting information, and making sense of graphs in everyday contexts. Perfect for classroom use or at-home practice, these worksheets provide essential foundations for math mastery. Start your child's journey into the exciting realm of data today!

Recycling Picture Graph Worksheet

Making a Graph: Creepy Crawlies Worksheet

Fruit Math: Picture Graphs Worksheet
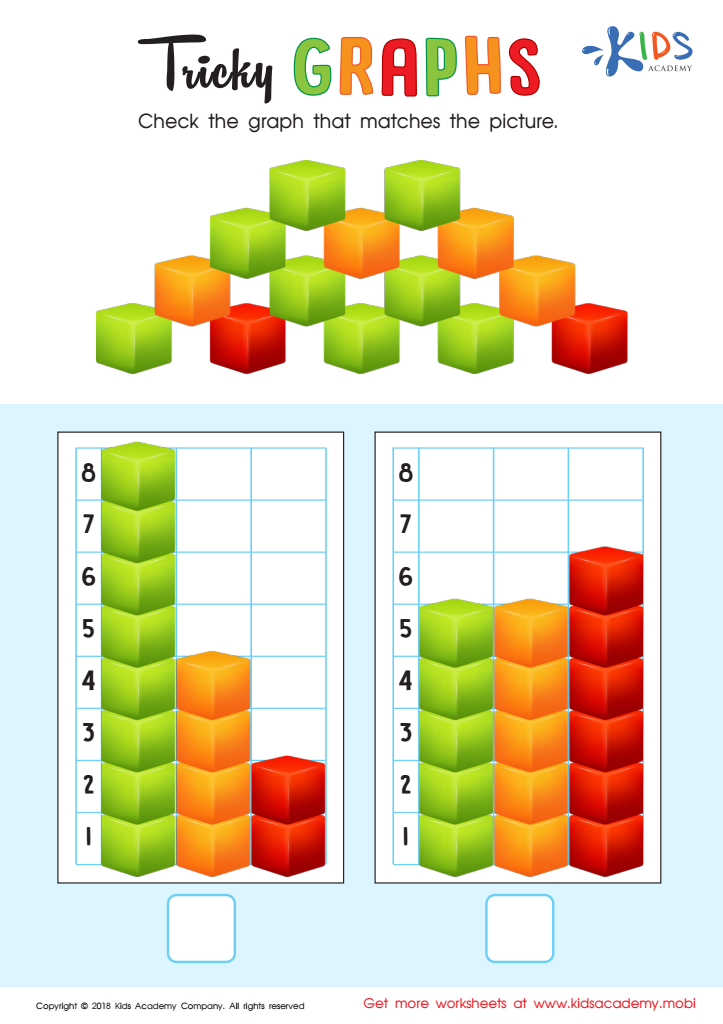
Tricky Graphs Worksheet

Match Tally Marks to Bar Graphs Worksheet

Aircraft Carrier Picture Graphs Worksheet


Understanding graphs is an essential skill for children aged 5-9, laying the foundation for critical thinking and data literacy. With an increasing amount of information presented in visual formats, such as pie charts, bar graphs, and line graphs, children who grasp these concepts will excel in both academic and real-life contexts. By early exposure to graph concepts, students can develop their ability to interpret data, recognize trends, and make informed decisions.
Parents and teachers should prioritize teaching graph literacy because it enhances mathematical understanding. Graphs provide a visual representation of numerical relationships, aiding children in comprehending abstract mathematical ideas. Moreover, engaging with graphs encourages curiosity and inquiry as children learn to explore data within their environment—whether it’s counting how many books they read, tracking weather patterns, or understanding sports statistics.
Furthermore, learning graphing skills fosters communication and collaborative skills, allowing children to present findings, discuss results, and understand differing viewpoints. This engagement promotes a growth mindset and nurtures a lifelong interest in science, math, and literacy. Ultimately, by investing in the understanding of graphs, parents and teachers empower young learners to navigate the increasingly data-driven world effectively.


