Understanding graphs Worksheets for Ages 6-9
6 filtered results
-
From - To
Unlock the world of data visualization with our "Understanding Graphs Worksheets" designed specifically for children aged 6-9! These engaging and interactive worksheets introduce young learners to the fundamentals of graphs, including bar graphs, pictographs, and line graphs. Through fun activities, kids will develop essential skills in interpreting data, identifying trends, and drawing conclusions. Our carefully crafted exercises promote critical thinking, boost math skills, and nurture a love for learning. Perfect for home or classroom use, these worksheets help children build confidence in understanding graphs while enjoying the learning process. Explore our collection to support your child's educational journey today!

Recycling Picture Graph Worksheet

Making a Graph: Creepy Crawlies Worksheet

Fruit Math: Picture Graphs Worksheet
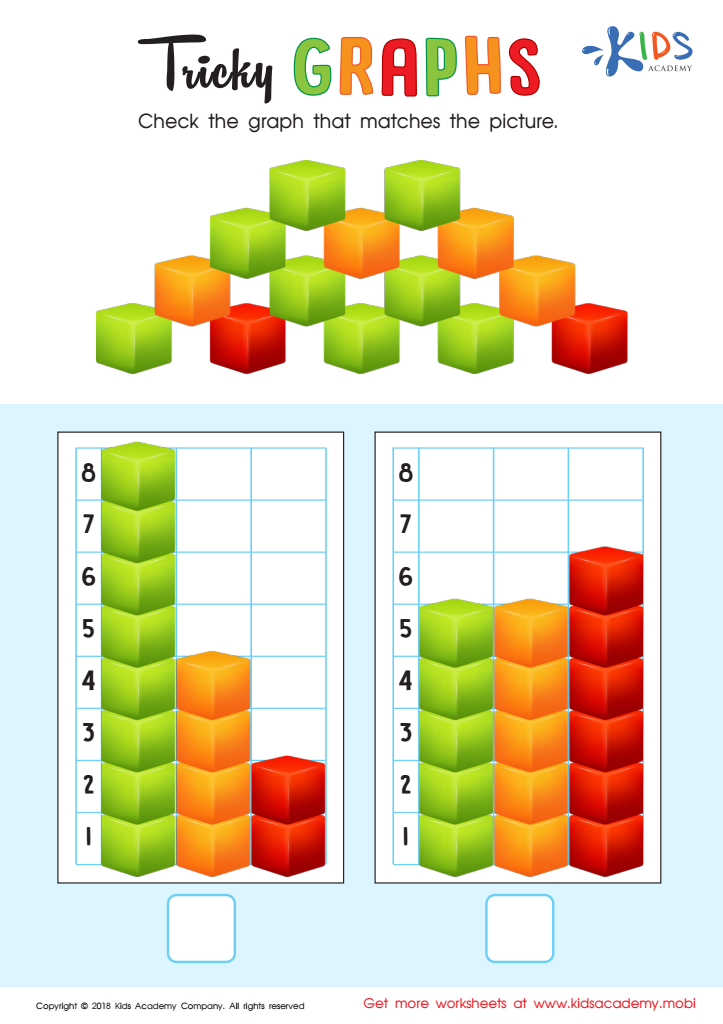
Tricky Graphs Worksheet

Match Tally Marks to Bar Graphs Worksheet

Aircraft Carrier Picture Graphs Worksheet


.jpg)
Understanding graphs is a crucial skill for children aged 6-9, as it lays the foundation for critical thinking and data literacy. At this developmental stage, children begin to engage with the concepts of measurement, comparison, and analysis. Graphs, whether they are pictographs, bar graphs, or line graphs, provide a visual representation of information that makes it easier for young learners to comprehend complex data and discern patterns.
By caring about teaching graph literacy, parents and teachers help students develop important skills such as interpreting information, making informed decisions, and understanding the world around them. Graphs serve as tools for storytelling and visual communication; they encourage children to ask questions and express their thoughts in a structured manner.
Moreover, these skills are essential for STEM (Science, Technology, Engineering, and Mathematics) learning, which is increasingly emphasized in today's educational landscape. Understanding graphs also fosters curiosity and engagement with real-world data, from weather patterns to sports statistics. Ultimately, by making graph comprehension a priority, parents and teachers empower children to become analytical thinkers and confident learners, setting the stage for academic success and informed citizenship in an information-driven society.


