Counting skills Graphs Worksheets for Ages 7-8
6 filtered results
-
From - To
Enhance your child’s counting skills with our engaging Graphs Worksheets designed specifically for ages 7-8! These interactive worksheets provide a fun and effective way for young learners to practice counting and graphing. Children will explore various graph formats, including bar and picture graphs, while engaging with real-world scenarios that make learning enjoyable. Our resources not only reinforce essential math skills but also promote critical thinking and data interpretation. Perfect for both classroom and home use, these worksheets are designed to boost confidence in young mathematicians. Start your child's math adventure today and watch their counting skills soar to new heights!
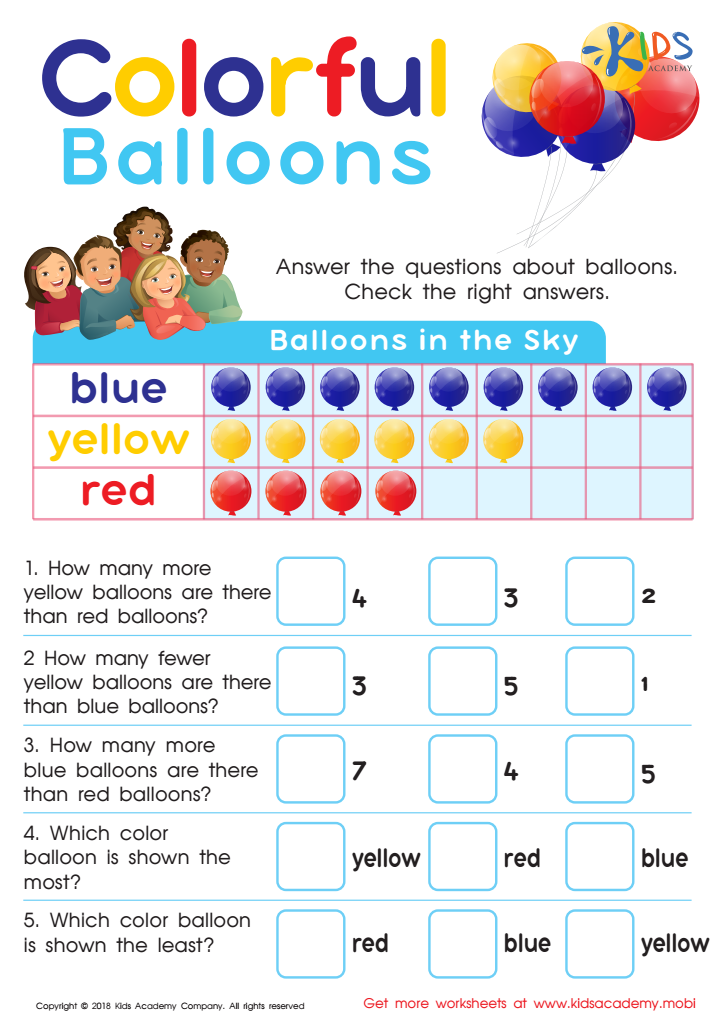
Picture Graphs: Colorful Balloons Worksheet

Taxi Math Worksheet

Leaf Bar Graph Worksheet

Fruit Math: Picture Graphs Worksheet

Graph: Baby Animals Worksheet

Aircraft Carrier Picture Graphs Worksheet


Counting skills and the ability to understand graphs are crucial components of early mathematics education for children aged 7-8. Developing strong counting skills lays a solid foundation for future mathematical concepts, such as addition, subtraction, and more complex operations. As children encounter numbers in various contexts, counting helps them understand quantity, patterns, and relationships.
Graphs, on the other hand, serve as a visual representation of data, allowing children to interpret information more easily. In today’s data-driven world, the ability to read and analyze graphs is essential. Teaching children how to create and interpret bar graphs, line graphs, and pictograms not only enhances their analytical skills but also fosters critical thinking and decision-making.
By emphasizing counting skills and graph literacy, parents and teachers empower children to engage with mathematics in a meaningful way. These skills facilitate improved performance in school subjects and promote confidence in problem-solving. Moreover, understanding graphs aids children in real-world scenarios, from reading maps and interpreting schedules to recognizing data trends in news articles. Ultimately, promoting these skills nurtures a strong foundation for lifelong learning and equips children to navigate an increasingly complex world.


