
Data interpretation Math Worksheets for 9-Year-Olds
4 filtered results
Difficulty Level
Grade
Age
-
From - To
Subject
Activity
Standards
Boost your 9-year-old's mathematical skills with our engaging Data Interpretation Math Worksheets! Designed specifically for young learners, these worksheets provide fun and interactive exercises that teach essential data analysis skills. From reading graphs and charts to interpreting data sets, our carefully crafted activities foster critical thinking and problem-solving abilities. Each worksheet is tailored to build confidence in understanding data, making math enjoyable and accessible. Perfect for both classroom and home learning, our worksheets encourage kids to connect real-world information with mathematical concepts. Start enhancing your child's data interpretation skills today and watch their love for math grow!
Favorites
With answer key
Interactive

Reading Bar Graph Worksheet
Take your child north to practice data reading with a polar bear friend! This worksheet challenges 3rd graders to interpret data on a graph and solve related math problems.
Reading Bar Graph Worksheet
Worksheet
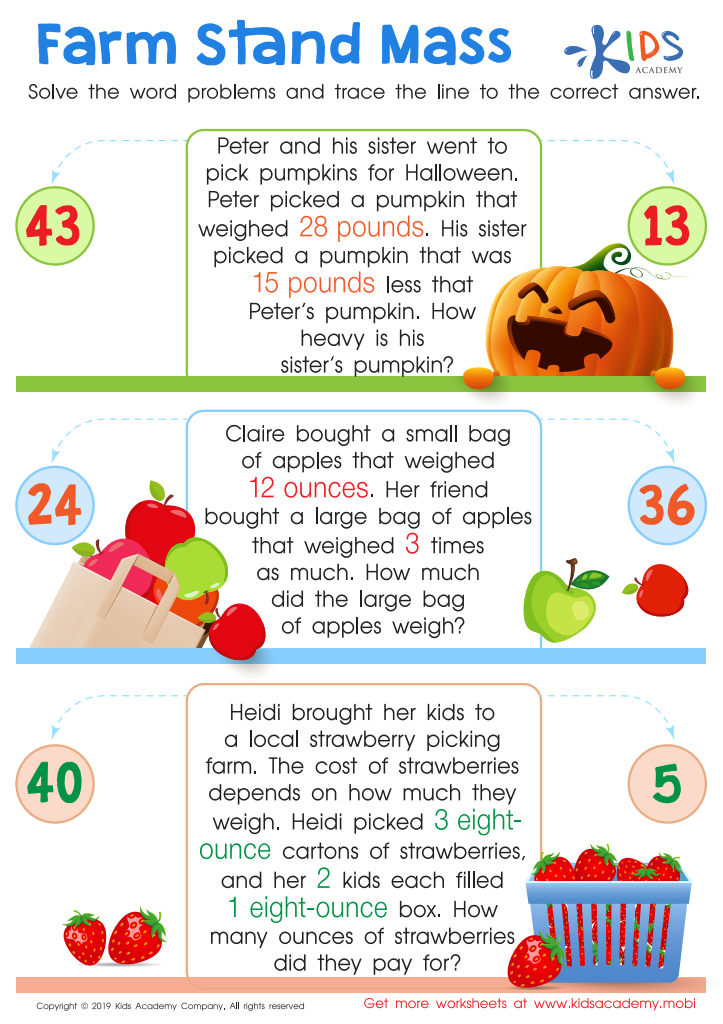
Farm Stand Mass Worksheet
Engage your kids in a fun learning adventure! Encourage them to practice what they learn in school using this worksheet. Look at the picture and read the problem together. Help them solve it and trace the line to the answer. Make learning enjoyable and your kids will be more motivated!
Farm Stand Mass Worksheet
Worksheet

Aircraft Carrier Picture Graphs Worksheet
Kids love learning about jets and boats with this awesome worksheet! It's a great way to engage them as they work on picture graphs. Representing numerical values with pictures, this free PDF requires them to choose which picture graph and representation best match the carrier in the picture. It's also great practice for visual discrimination!
Aircraft Carrier Picture Graphs Worksheet
Worksheet

Leaf Measure Line Plot Worksheet
Help your third grader measure each of the four leaves, and check the box with the correct measurements. Then, trace the right number of x's to make a line plot showing the data. This exercise will engage your students and make it easier for them to grasp the concept of line plots.
Leaf Measure Line Plot Worksheet
Worksheet
Join Kids Academy for Free
Who is primarily going to use this learning content?


Data interpretation is a crucial skill for 9-year-olds, and it deserves the attention of both parents and teachers. At this age, children are developing foundational mathematical skills that will serve them throughout their education and adult lives. Understanding how to interpret data enhances analytical thinking and fosters critical reasoning skills. Children engage with data through activities such as chart reading, graph interpretation, and surveys, which makes math relevant and relatable to their everyday experiences.
Moreover, data interpretation links mathematics to real-world contexts, allowing children to analyze information, draw conclusions, and make informed decisions. For instance, they may encounter statistics regarding sports, environmental issues, or trends in their communities. Learning to interpret this data helps them grasp the importance of facts versus opinions, cultivating informed citizenship.
Additionally, proficiency in data interpretation prepares students for advanced mathematical concepts in higher grades, where data analysis plays a significant role in various subjects, including science and social studies. By investing time in this area, parents and teachers can support children's overall cognitive development, promoting a growth mindset and empowering them to navigate the increasingly data-driven world they will inherit. Thus, engaging in data interpretation is not just about math; it's a pathway to becoming informed, critical thinkers.


