Counting skills Extra Challenge Graphs Worksheets for Ages 7-9
3 filtered results
-
From - To
Enhance your child's counting skills with our engaging Extra Challenge Graphs Worksheets designed for ages 7-9! These worksheets provide a fun way to explore counting, data interpretation, and graphing. Children will discover how to represent numbers visually, practice addition and subtraction, and deepen their understanding of early mathematics concepts. Perfect for classroom use or at-home learning, these activities encourage critical thinking and analytical skills while building confidence in math. With a variety of exercises that challenge young learners, these worksheets ensure a well-rounded approach to mastering counting through interactive and enjoyable tasks. Start the journey to math mastery today!
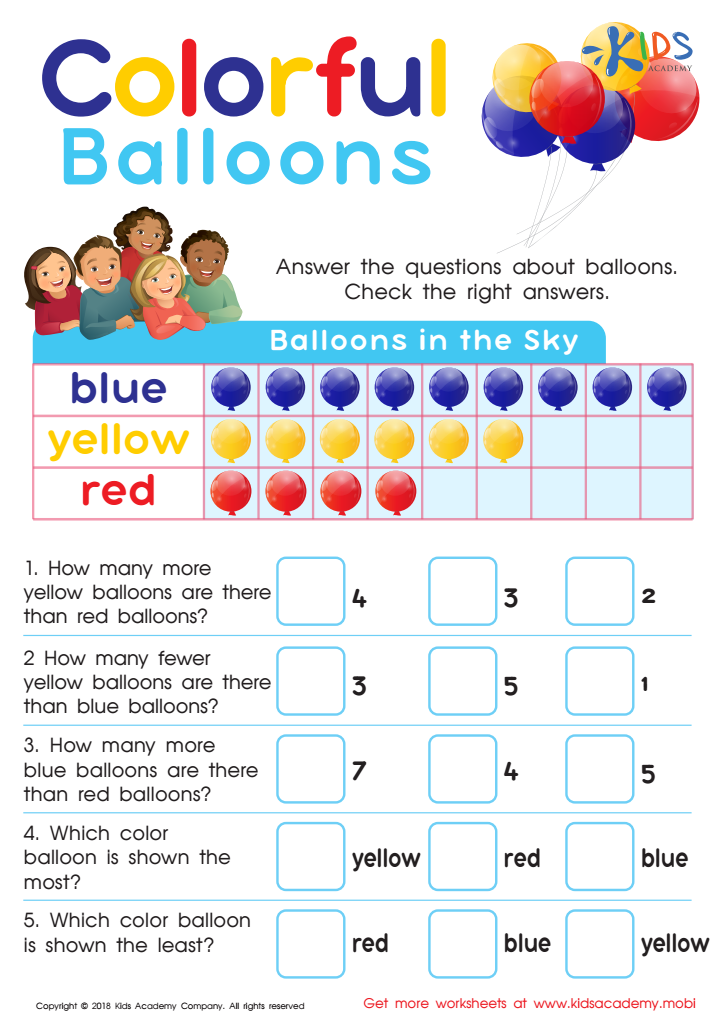
Picture Graphs: Colorful Balloons Worksheet

Taxi Math Worksheet

Leaf Bar Graph Worksheet


Counting skills and graphing are fundamental components of early mathematics education, particularly for children aged 7-9. At this developmental stage, mastering counting lays the groundwork for more complex math concepts. By incorporating Extra Challenge Graphs into learning, educators and parents can create an engaging environment that promotes critical thinking and analytical skills.
Firstly, counting skills enable children to understand numerical relationships and establish a strong mathematical foundation. When children can count accurately and efficiently, they become more confident in problem-solving tasks. Graphs help visualize this knowledge, making abstract concepts tangible. The use of Extra Challenge Graphs encourages students to interpret data, draw conclusions, and identify trends, which fosters higher-order thinking.
Additionally, engaging with graphs cultivates essential skills like organization, comparison, and communication of information. As children create and analyze various graphs, they learn how to represent data succinctly, thereby enhancing their understanding of the world around them. This combination of counting and graphing not only prepares students for standardized assessments but also nurtures an enduring interest in math. It equips them with the tools to make informed decisions, shaping their ability to navigate real-life situations effectively. Thus, both parents and teachers should prioritize and support these crucial skills.


