Explore our "Understanding Bar Graphs Extra Challenge Worksheets" designed for 9-year-olds! These engaging worksheets offer advanced practice in interpreting and creating bar graphs, helping students enhance their data analysis skills. Featuring a variety of scenarios and questions, our materials encourage critical thinking and comprehension of graphical representations. Ideal for aspiring mathematicians, these challenges promote deeper understanding of concepts like scale, comparison, and trends. Parents and educators will find these worksheets invaluable for supporting curriculum goals and fostering a love for math. Dive into the world of data visualization and empower your child's learning journey with these fun, interactive activities!


Check out this FREE "Understanding bar graphs" Trial Lesson for age 9!

Bar Graphs 1 Step Word Problems

Favorites
With answer key
Interactive
  • 9
  • Understanding bar graphs
  • Extra Challenge
Reading a Bar Graph Worksheet 3rd Grade

Reading Bar Graph Worksheet

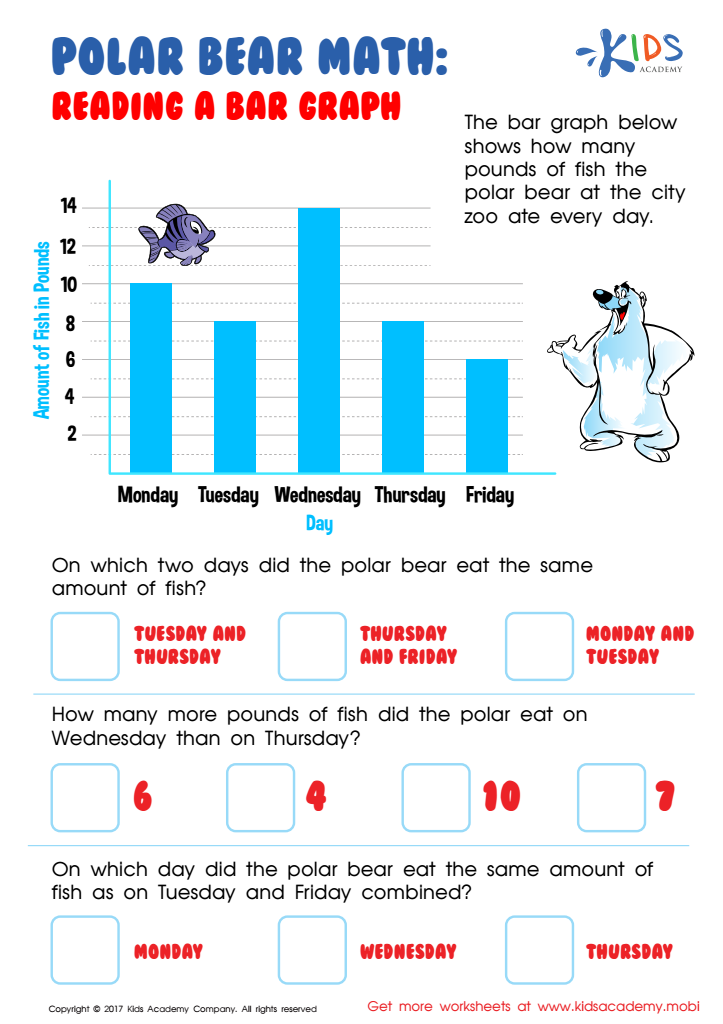
Take your child north to practice data reading with a polar bear friend! This worksheet challenges 3rd graders to interpret data on a graph and solve related math problems.
Reading Bar Graph Worksheet
Worksheet
Planets Bar Graph Worksheet

Planets Bar Graph Worksheet

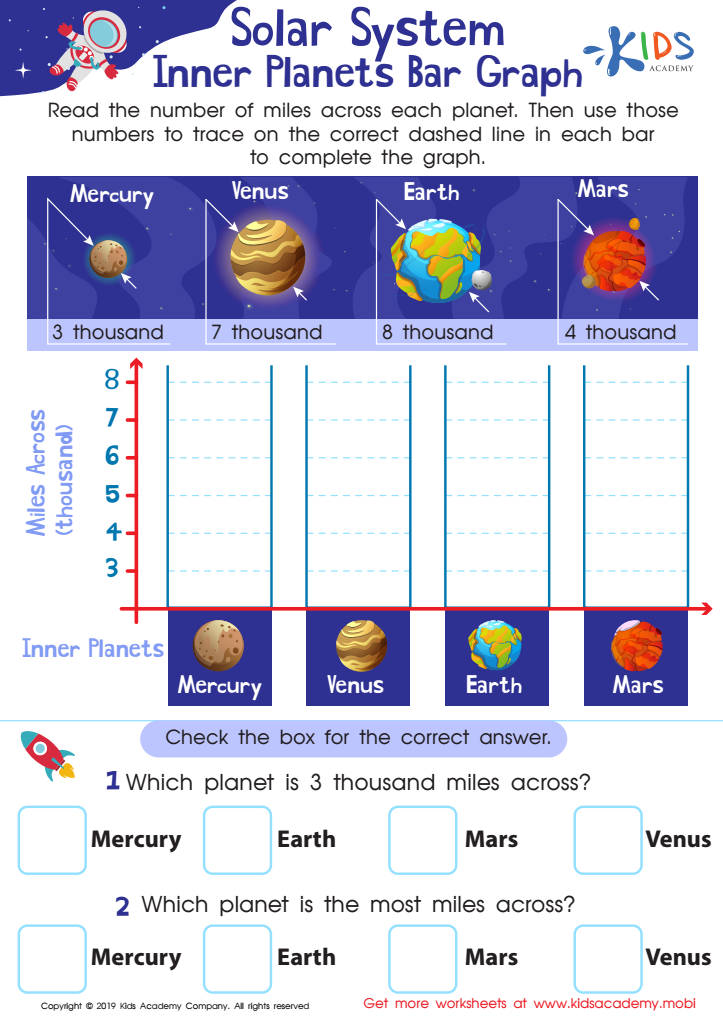
With this fun, educational worksheet, kids can learn about bar graphs and the solar system simultaneously. Introduce them to the concept by reading out the number of miles for each planet, then help them trace the dashed lines in each bar to complete the graph.
Planets Bar Graph Worksheet
Worksheet
Leaf Bar Graph Worksheet

Leaf Bar Graph Worksheet

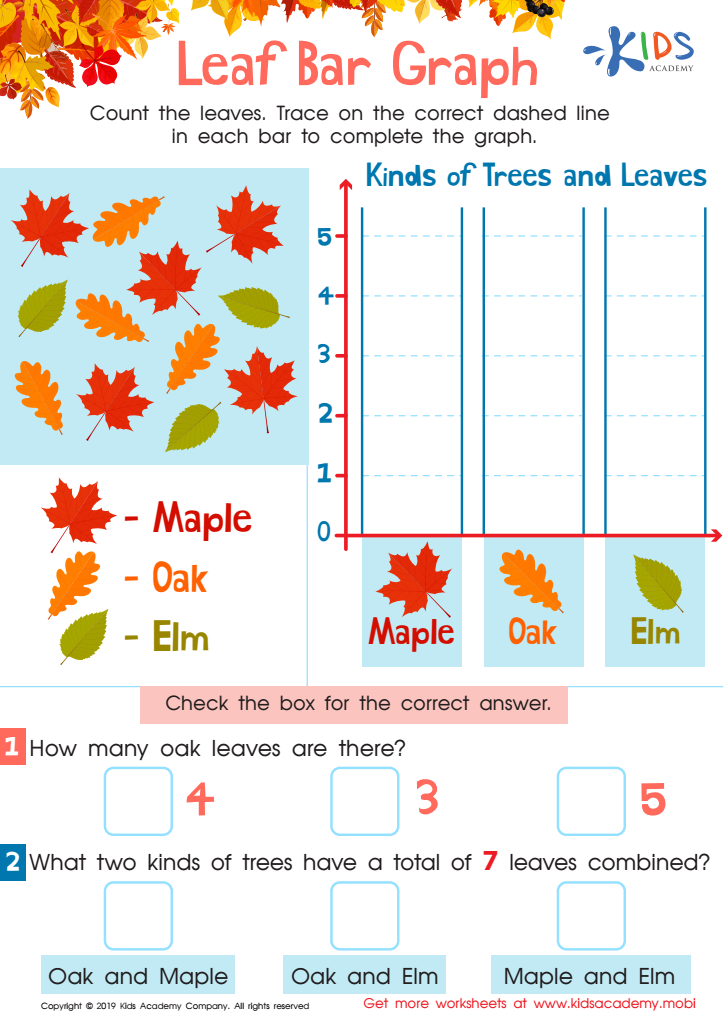
You can help your kids make learning easier and more enjoyable. While their teachers provide lessons and homework, you can take their education further. This worksheet can assist them in mastering bar charts. Count the leaves, then trace the correct line for each bar to complete the graph.
Leaf Bar Graph Worksheet
Worksheet


Understanding bar graphs is a fundamental skill that equips 9-year-olds with essential mathematical and analytical abilities. Parents and teachers should care about this for several reasons.

Firstly, bar graphs visually represent data, making complex information easier to digest. This is particularly important for young learners, as they develop the skills to interpret and analyze data in a world increasingly driven by information.

Secondly, bar graphs promote critical thinking. When children engage in "Extra Challenge" activities, they learn to ask questions, identify trends, and draw conclusions based on graphical data. This fosters a mindset of inquiry that is beneficial not only in math but across all subjects.

Furthermore, proficiency in understanding bar graphs lays a foundation for future learning in statistics and data analysis, skills that are crucial in many careers. This early exposure can ignite a passion for subjects like science, economics, or technology.

Finally, involving parents in discussions about graphs can enhance relationships by promoting cooperative learning. By encouraging children to explore and challenge their understanding of bar graphs, parents and teachers can support their academic growth and help build confidence in their analytical skills. In essence, understanding bar graphs is a critical stepping stone for lifelong learning.