Interpreting charts Worksheets for Kids
1 filtered results
-
From - To
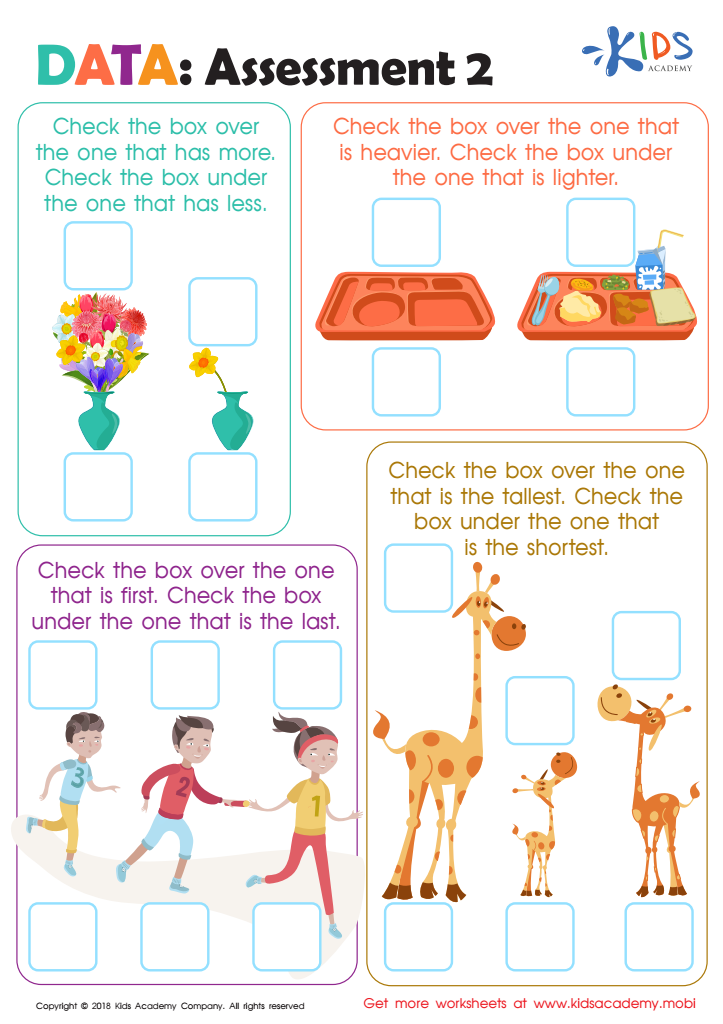
Data: Assessment 2 Worksheet
Question/Answer
What are some effective activities to train students’ Interpreting charts skill when teaching them about Geometry?
Effective activities for training students in interpreting charts in Geometry include: creating and analyzing geometry-related graphs (like pie charts of angle measures), interpreting bar graphs on geometric property frequencies, using scatter plots to explore relationships between geometric figures, and decoding histograms related to geometric measurements. Incorporating interactive tools and software enhances understanding and engagement.
How to train the Interpreting charts skill in Preschool students learning about Geometry?
To train preschool students in interpreting charts related to geometry, start by using simple, colorful shapes and charts. Introduce basic geometric shapes in various colors and sizes, and use visual aids like pie charts or bar graphs showing these shapes.
Why is the Interpreting charts skill important for Preschool students?
The Interpreting charts skill is important for preschool students because it lays the foundation for basic data interpretation and mathematical concepts. It helps develop critical thinking, pattern recognition, and decision-making skills at an early age, fostering an understanding of visual information, which is essential for academic success and everyday problem-solving as they grow.