Graph Worksheets and Lessons for 9-Year-Olds
March 19, 2024
Learning to read different types of graphs is a crucial skill for early learners. After all, graphs are powerful visual tools that help children understand and interpret data, fostering critical thinking and analytical skills. Early in elementary school, students are typically introduced to graphs through tally charts as early as kindergarten. By the time they reach nine years old, it’s important that students learn to read and analyze different types of graphs.
Learning to read graphs may seem like a tricky skill for a 9-year-old to understand, but with hands on practice and the right materials, they can easily grasp the concept and be well on their way to becoming little data analysts.
While it may seem as though data analysis is a boring skill to learn, with a little bit of creativity, graphs can be an enjoyable skill for students to master, especially when they experience relevant, hands-on practice. Let’s explore the different types of graphs your little data analyst needs to learn and the best strategies to use to teach each kind. Later, check out graphs worksheets for 9-year-olds from Kids Academy to find resources to support your child’s learning!

Graphs for 9-Year-Old Kids: What to Teach?
Most 9-year-olds are already in the third or fourth grades, but all should have prior knowledge of simple graphs. Some are easier to learn than others, while certain types of graphs can be rather tricky to interpret. Beyond simple tally charts, there are 3 main types of graphs that students must learn:
- Pictographs
Picture graphs, also known as Pictographs, are an especially fun way to display data! They use pictures as symbols to represent numerical data. Because this type of graph offers children a visual way to understand data, pictographs are usually the easiest type to grasp.
Each picture represents a specific amount of the item being quantified and a key is provided to show the value of each image depicted, as shown in this worksheet:
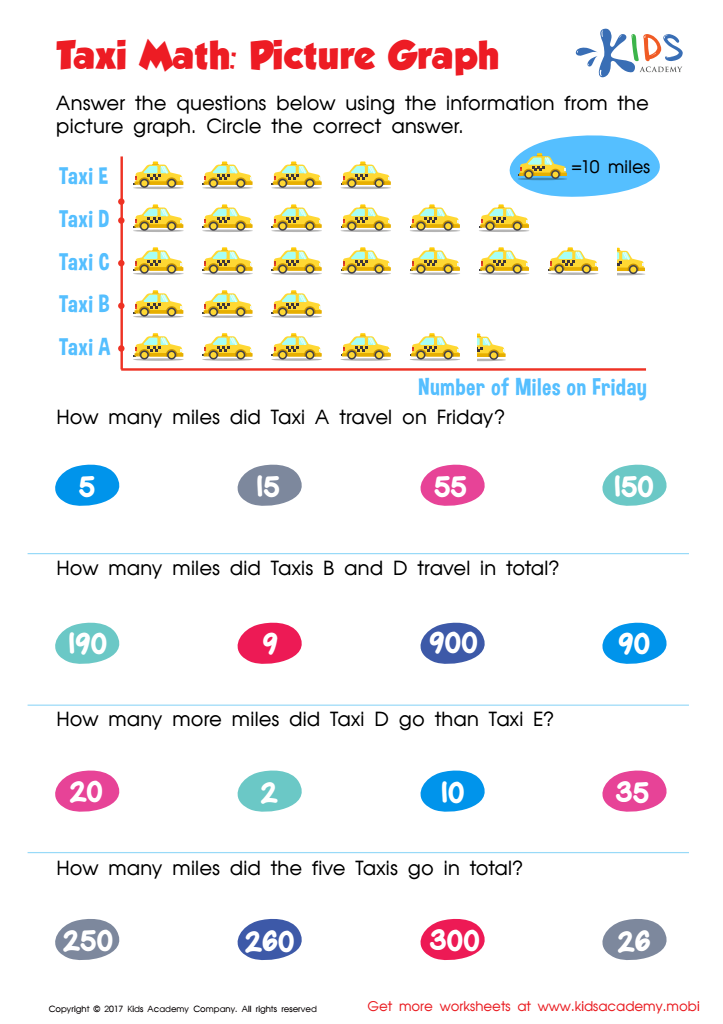
The key indicates that each taxi symbol represents 10 miles. Children add or multiply to determine how many miles each taxi traveled to answer each question.
The best way to introduce pictographs is by offering them hands-on practice using small manipulatives, such as candy pieces. For instance, students can create their own picture graph to find out how many of each color is included in a bag of Skittles or M&M’s. Not only is hands-on practice fun, but it also makes learning more “real” because they relate the strategy to everyday life. Once kids have practiced interpreting and creating their own graphs, worksheets are great for further practice.
- Bar Graphs
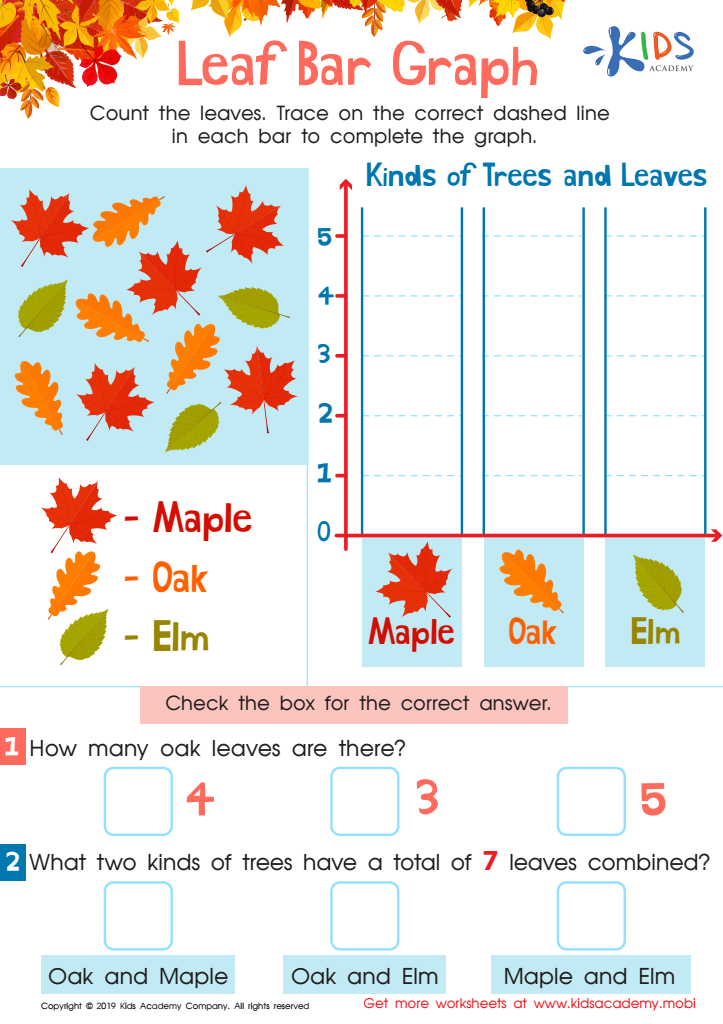
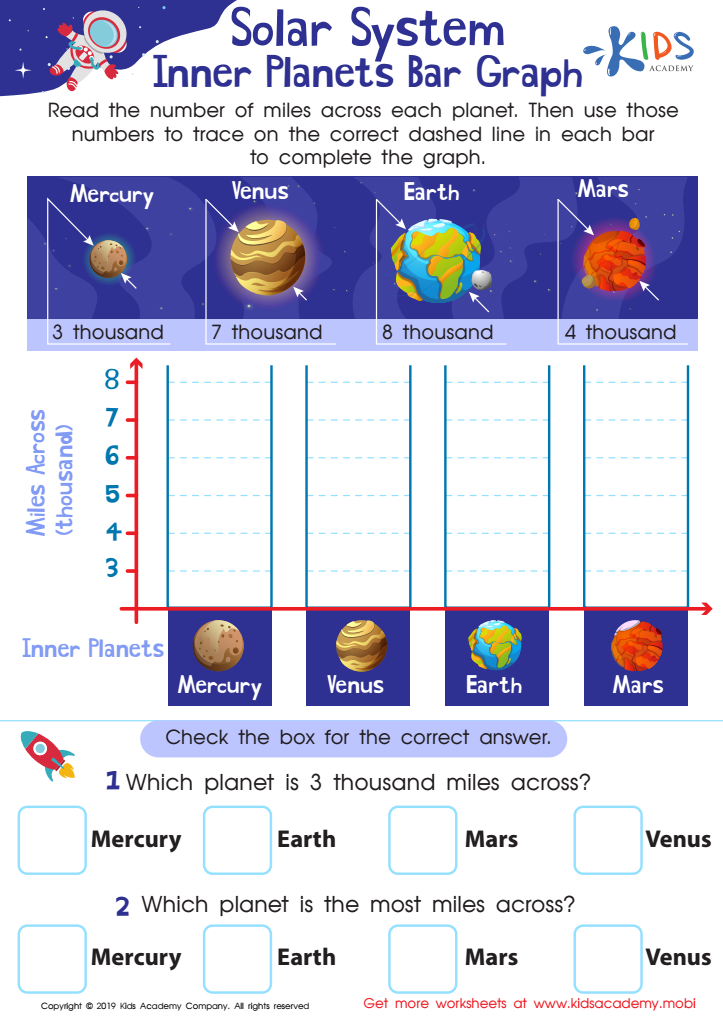
Bar graphs are a lot like pictographs, but they use simple, rectangular bars instead of symbols to represent an amount. The bars can be displayed either vertically or horizontally, and children should practice with both. Bar graphs are often used to compare data between different groups, or to show a difference over time.
In each of the worksheets shown above, learners must compare data between different groups. In the leaf bar graph, children compare how many of each type of leaf is collected, while in the solar system graph, they compare each planet’s size.
Just like pictographs, it’s best to introduce bar graphs in a way that allows children to create their own using relevant, true-to-life data they collect. Parents or teachers should first model the different parts of the graph first to reinforce mathematical vocabulary. After hands-on practice, learners can utilize worksheets to practice interpreting graphs.
- Line Plots
Line plot graphs are tricker to teach, mostly because they are often more complex than picture or bar graphs. This is because both the category that is being compared, and the scale being used to compare them are numerical. For instance, in the pictograph above, only the taxi symbols represent a numerical value. However, on a line plot, the scale itself represents a numerical value, too.
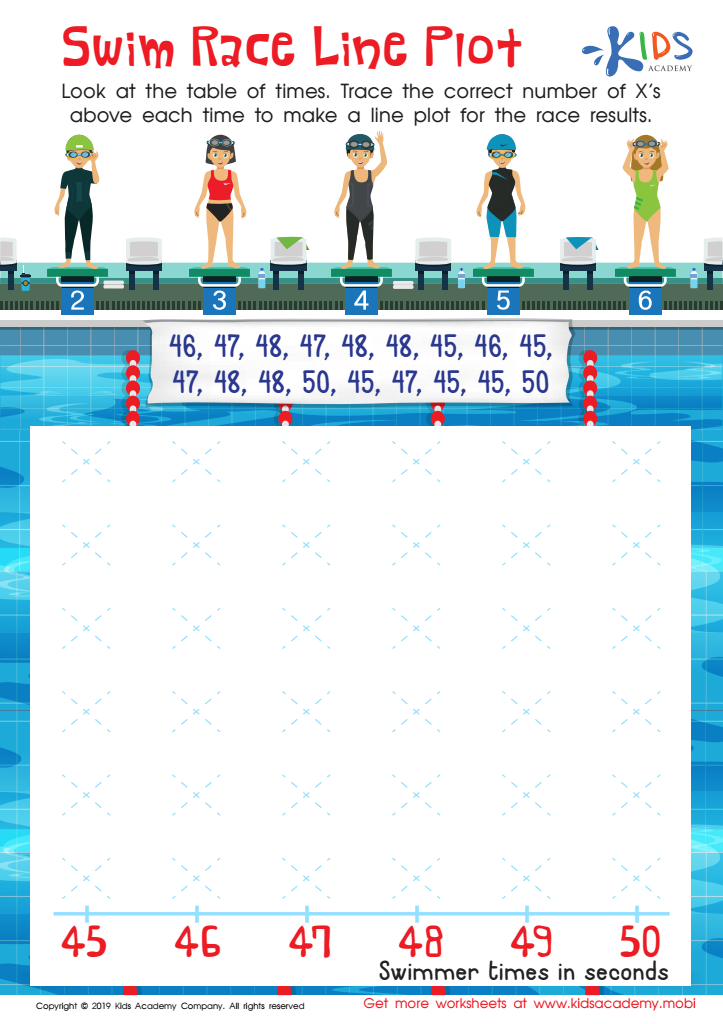
On the line plot above, learners are comparing how many swimmers earned specific times to tally the race results. Not only are they determining how many swimmers earned what time, but they will also compare which times are most and least common. The scale to which they are comparing is numerical (the times in seconds), as is the category itself (how many swimmers earned that time). This worksheet breaks down the task in an easy-to-understand way, which allows children to record the data for themselves based on the table of swimmer times.
Because reading line plots, as well as other graph types can be difficult, Kids Academy also offers activities grouped together in lessons to provide vital practice:
In fact, Kids Academy’s lessons on graphs for kids aged 9 conveniently cover all the different types of graphs to offer targeted practice materials. Our standards-aligned lessons combine age and grade-appropriate materials on a variety of topics that users can find easily.
And if you’re looking for graph worksheets for different ages, there is a handy new feature that allows users to filter all the activities in our library by age - including worksheets, videos, quizzes and lessons.
Learning to read graphs may seem like a tricky skill for a 9-year-old to understand, but with hands on practice and the right materials, they can easily grasp the concept and be well on their way to becoming little data analysts. Find all our lessons and worksheets at www.kidsacademy.mobi, and filter by age to find the right resources for your child!


