Understanding graphs Numbers Worksheets for Ages 7-8
3 filtered results
-
From - To
Help young learners grasp essential math skills with our "Understanding Graphs Numbers Worksheets for Ages 7-8." These engaging, printable worksheets make it easy and fun for children to explore different types of graphs, including bar graphs, pictographs, and line plots. Designed to build analytical skills, our activities guide students through reading and interpreting data, enhancing their ability to communicate mathematical information effectively. Perfect for classroom use or homeschooling, these worksheets support a well-rounded understanding of numerical relationships and data visualization. Empower your child with the skills they need for academic success by incorporating our expertly crafted resources into their learning journey.

Making a Graph: Creepy Crawlies Worksheet
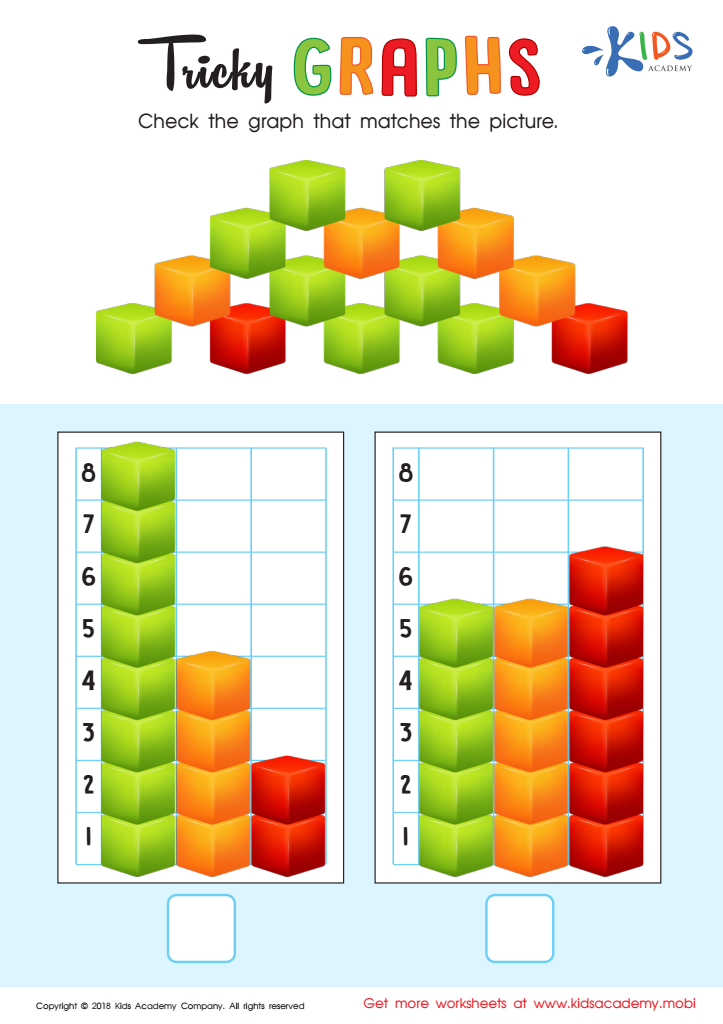
Tricky Graphs Worksheet

Match Tally Marks to Bar Graphs Worksheet


Understanding graphs and numbers is crucial for children ages 7-8, laying a solid foundation for future academic success and daily life skills. At this age, children transition from basic counting to more complex mathematical concepts. Introducing graphs helps them visualize and interpret data, fostering analytical skills that apply across subjects, including science and social studies.
Graphs transform numbers into visual stories, making abstract concepts tangible. This aids comprehension and retention, encouraging critical thinking. For example, a bar chart can help them compare quantities effortlessly, while a line graph shows trends over time. These skills promote logical reasoning and problem-solving abilities.
Furthermore, proficiency in interpreting graphs equips children with tools for real-world scenarios. Whether reading a weather chart, understanding nutritional information, or managing simple finances, these are life-long competencies.
For teachers, incorporating graphs can diversify lesson plans, making learning more dynamic and engaging. Interactive graphing activities foster collaborative learning and student participation.
For parents, supporting graph literacy reinforces school curriculum and helps with practical home activities, such as reading schedules or following simple instructions involving measurements.
In essence, embracing graphs and numbers at ages 7-8 not only aligns with educational standards but also equips children with essential skills for diverse life applications.