Graph reading skills Math Worksheets for Ages 7-8
3 filtered results
-
From - To
Enhance your child’s math journey with our engaging Graph Reading Skills worksheets designed specifically for ages 7-8! These worksheets focus on developing essential graph interpretation abilities, enabling students to read and analyze data effectively. Each activity encourages critical thinking as kids learn to navigate bar graphs, line graphs, and pictographs. With colorful illustrations and real-world examples, your child will find math fun and relevant. Ideal for home or classroom use, our printable resources cater to diverse learning styles, ensuring every child can master these crucial skills. Get started today to boost your child’s confidence and elevate their math comprehension!
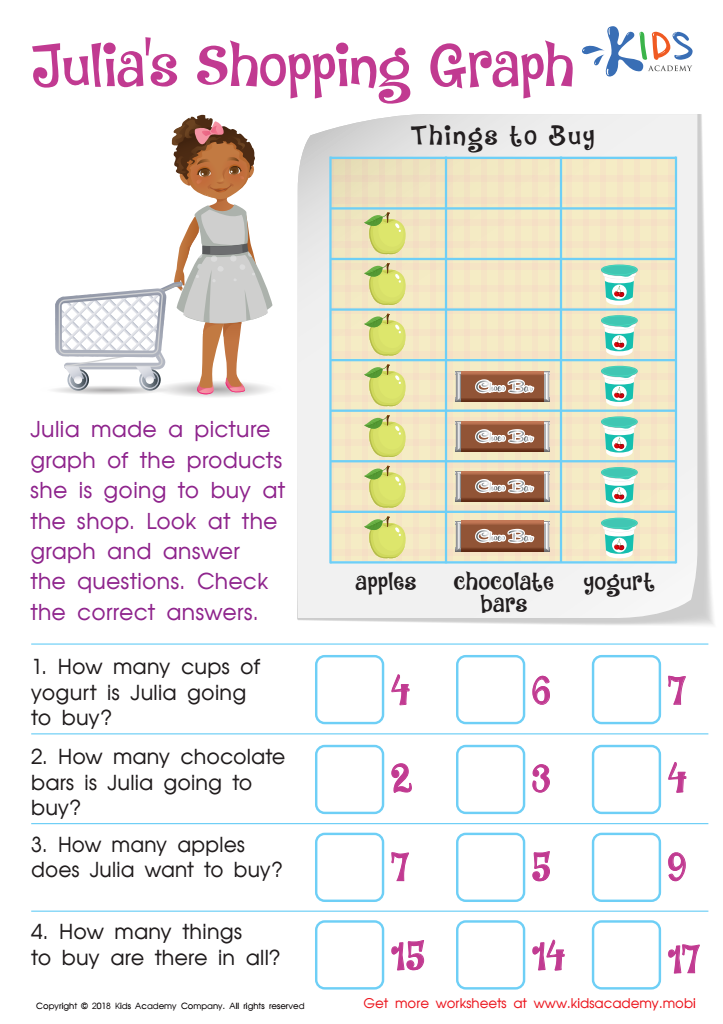
Julia's Shopping Graph Worksheet
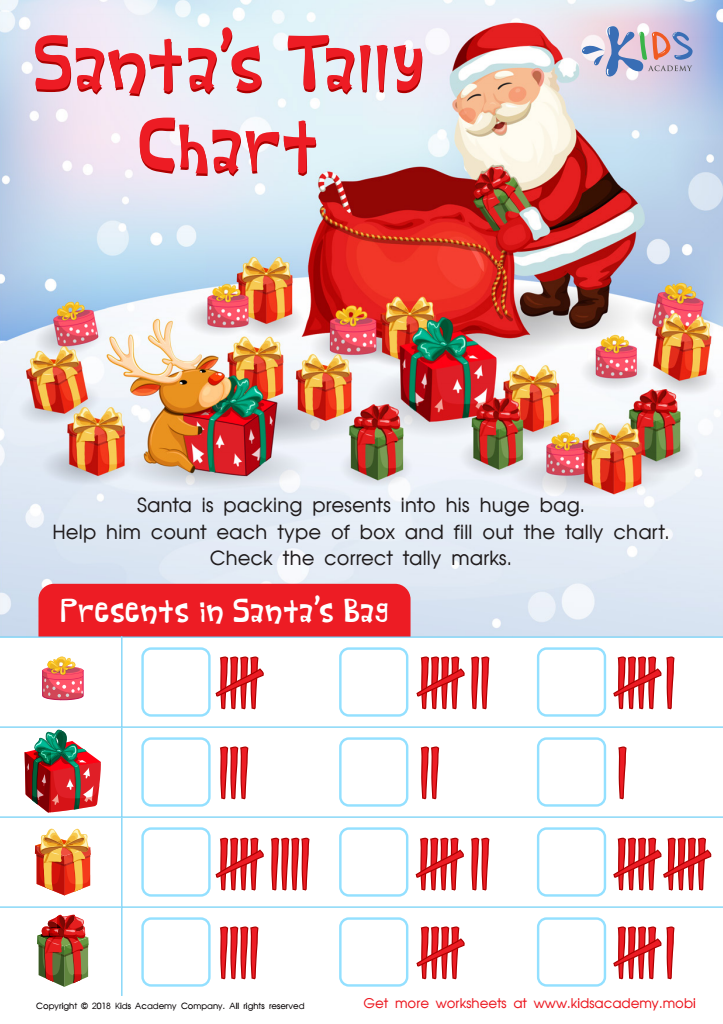
Santa Tally Chart Worksheet
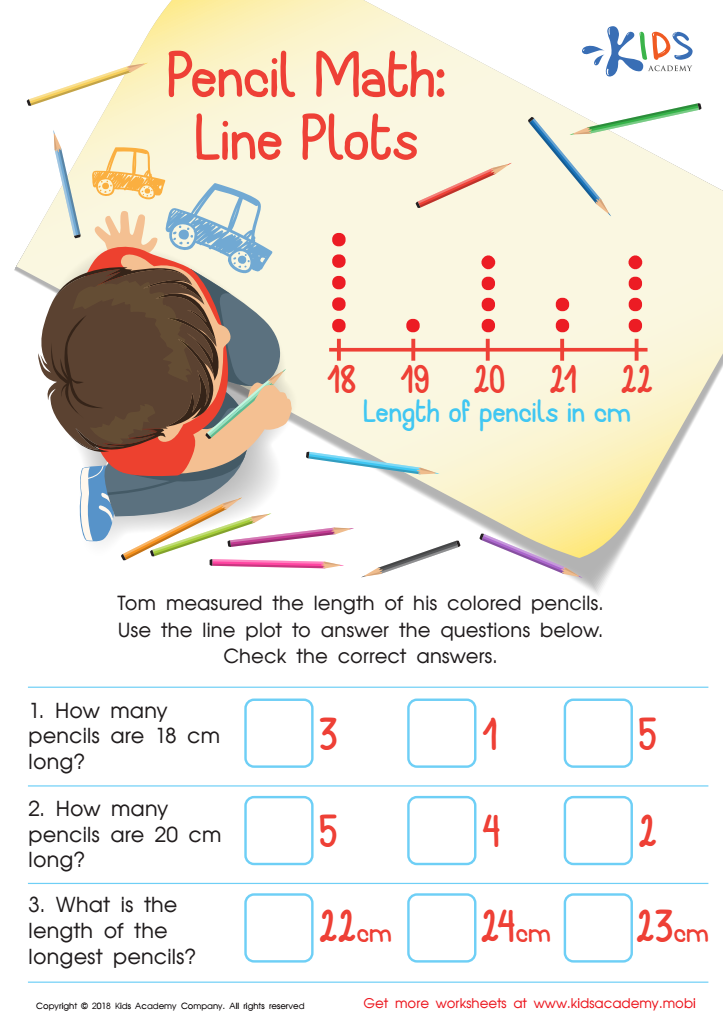
Pencil Math: Line Plots Worksheet


Graph reading skills are essential for children aged 7-8 as they lay the foundation for critical thinking and problem-solving abilities. At this stage, students begin to encounter different types of graphs—such as bar graphs, line graphs, and pictographs—integrating visual representation with numerical data. Understanding these graphs helps children interpret information, draw conclusions, and make informed decisions.
Moreover, graph reading fosters analytical skills crucial not only in mathematics but across subjects, including science and social studies. It enables students to comprehend trends, make comparisons, and communicate findings effectively. For instance, analyzing a graph shows children how to relate numerical data to real-world situations, encouraging a deeper understanding of contexts such as weather patterns or population growth.
Additionally, developing these skills supports mathematical fluency, as interpreting graphs often involves addition, subtraction, and basic multiplication. This early exposure demystifies data and statistics, reducing anxiety around numbers and promoting a positive attitude toward math.
Ultimately, when parents and teachers emphasize graph reading skills, they enhance children's overall academic performance, preparing them for more complex mathematical concepts and ensuring they have the tools to navigate an increasingly data-driven world.


