Understanding graphs Worksheets for Ages 7-9
6 filtered results
-
From - To
Explore our "Understanding Graphs Worksheets" tailored for children aged 7-9! These engaging resources help young learners grasp the fundamentals of data representation, including bar graphs, pictograms, and line plots. Through interactive exercises and fun activities, kids will develop essential skills in reading, interpreting, and creating graphs, enhancing their analytical thinking and mathematical confidence. Our worksheets are designed to align with educational standards, making learning both effective and enjoyable. Perfect for home or classroom use, these printable worksheets provide endless opportunities for practice and mastery. Equip your child with the tools to navigate the world of graphs and data visualization!

Recycling Picture Graph Worksheet

Making a Graph: Creepy Crawlies Worksheet

Fruit Math: Picture Graphs Worksheet
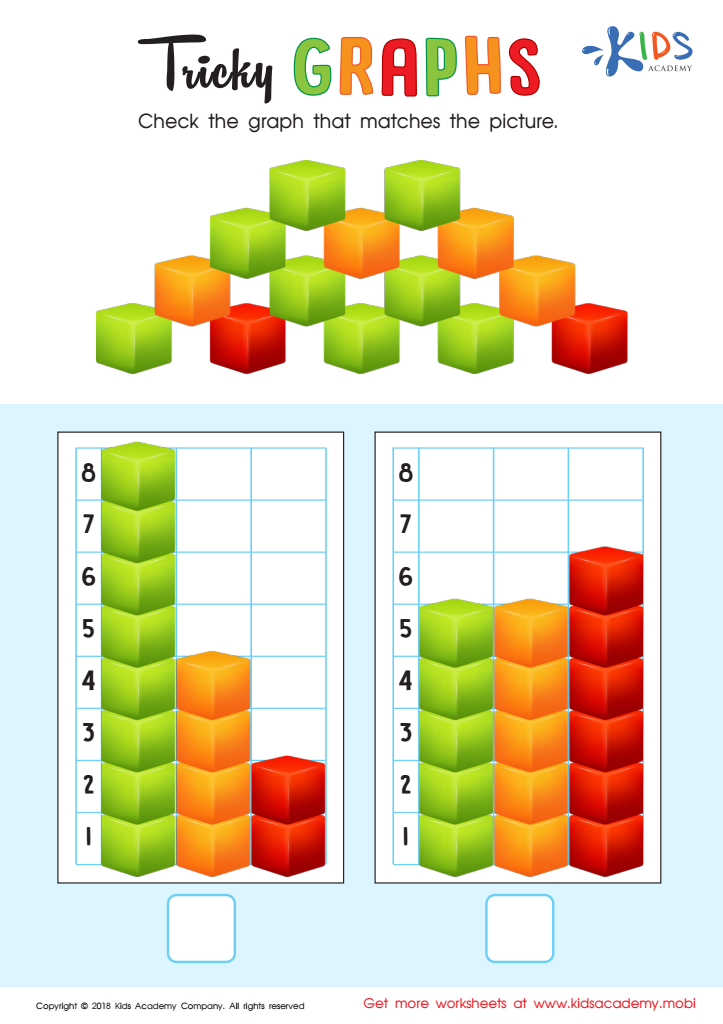
Tricky Graphs Worksheet

Match Tally Marks to Bar Graphs Worksheet

Aircraft Carrier Picture Graphs Worksheet


Understanding graphs is essential for children aged 7-9, as it lays the foundation for critical thinking and problem-solving skills that will be valuable throughout their education and daily lives. At this age, students are beginning to engage with data in more sophisticated ways, making it crucial for parents and teachers to emphasize graph comprehension.
Graphs serve as visual representatives of information, making complex data more accessible and understandable. By teaching children how to read and interpret different types of graphs—such as bar graphs, line graphs, and pie charts—they develop essential analytical skills. Graphs also encourage kids to engage with mathematical concepts like counting, addition, and subtraction in a tangible way.
Furthermore, learning to create and interpret graphs enhances students' communication skills, fostering their ability to convey information clearly and effectively. This competency will be crucial as they encounter more complex subjects in higher grades.
In today's data-driven world, graph literacy is a vital skill, equipping students to navigate, analyze, and evaluate information critically. Parents and teachers play a pivotal role in helping children develop these skills, ensuring they are prepared for future academic challenges and a data-rich environment.


