Counting skills Graphs Worksheets for Ages 7-9
6 filtered results
-
From - To
Enhance your child's counting skills with our engaging Graphs Worksheets designed specifically for ages 7-9. These printable resources provide an interactive way for kids to learn and visualize numerical relationships through fun and colorful graphs. Students will explore counting concepts through various activities that promote critical thinking and problem-solving. From bar graphs to tally charts, each worksheet is crafted to reinforce counting proficiency and data representation. Encourage your young learner to strengthen their mathematical abilities and make learning enjoyable with our exclusive collection of worksheets that build confidence and enthusiasm for counting and graphing. Download now to start the journey!
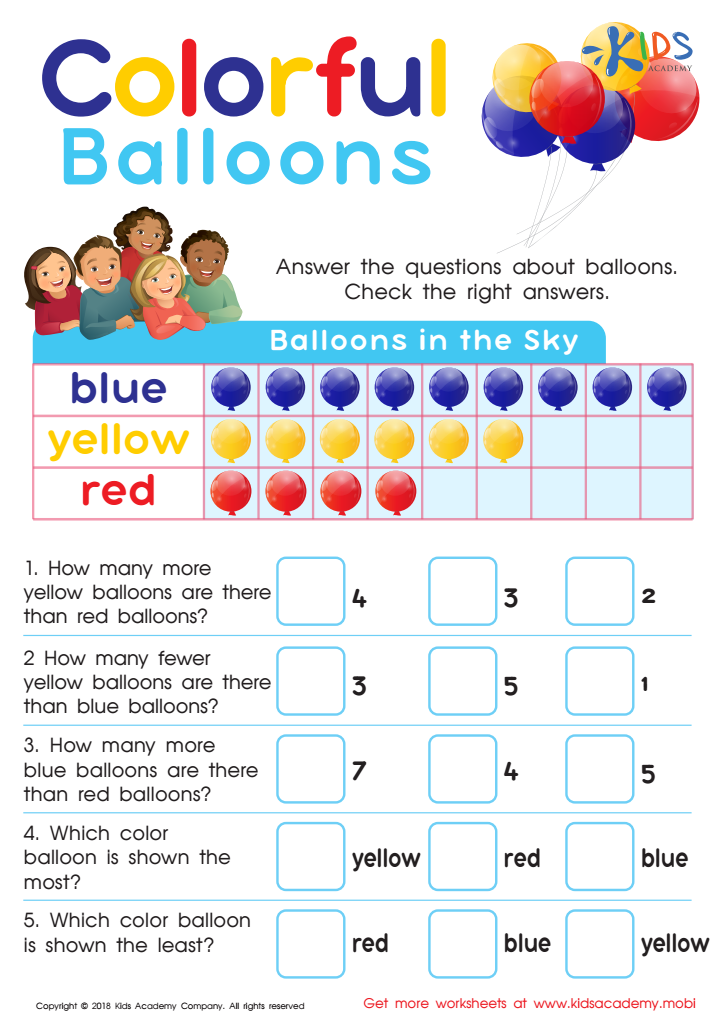
Picture Graphs: Colorful Balloons Worksheet

Taxi Math Worksheet

Leaf Bar Graph Worksheet

Fruit Math: Picture Graphs Worksheet

Graph: Baby Animals Worksheet

Aircraft Carrier Picture Graphs Worksheet


Counting skills and graphs are essential components of mathematics education for children aged 7-9, laying the foundation for future learning and critical thinking. During these formative years, children are developing their ability to understand numerical concepts, relationships, and data representation. Proficient counting skills enhance their ability to perform operations like addition and subtraction, fostering mathematical fluency that is vital in everyday life.
Graphs, on the other hand, serve as valuable tools for visualizing and interpreting data. When children learn to create and analyze graphs, they develop critical analytical skills, enabling them to identify trends and make informed decisions based on data. Comprehending different types of graphs, such as bar graphs and pie charts, also enhances their ability to communicate findings effectively.
Additionally, engaging with counting skills and graphs promotes logical reasoning and problem-solving abilities, crucial skills in the 21st century. Parents and teachers should prioritize these concepts to not only support academic success but also to help children gain confidence in their ability to navigate numerical information and make sense of the world around them. Investing in these skills now will prepare children for more complex mathematical concepts and real-life applications in the future.


