Graph interpretation Worksheets for 7-Year-Olds
3 filtered results
-
From - To
Our engaging Graph Interpretation Worksheets for 7-Year-Olds provides young learners with essential skills in reading and understanding various types of graphs. Designed specifically for curious minds, these worksheets feature age-appropriate activities that help children interpret bar graphs, line graphs, and pictographs accurately. Through a range of interactive exercises, kids will learn to extract valuable information, compare data, and draw meaningful conclusions, fostering both critical thinking and analytical skills. Ideal for both classroom and at-home learning, our worksheets make mastering graph interpretation both fun and effective, setting a strong foundation for future math and science success.
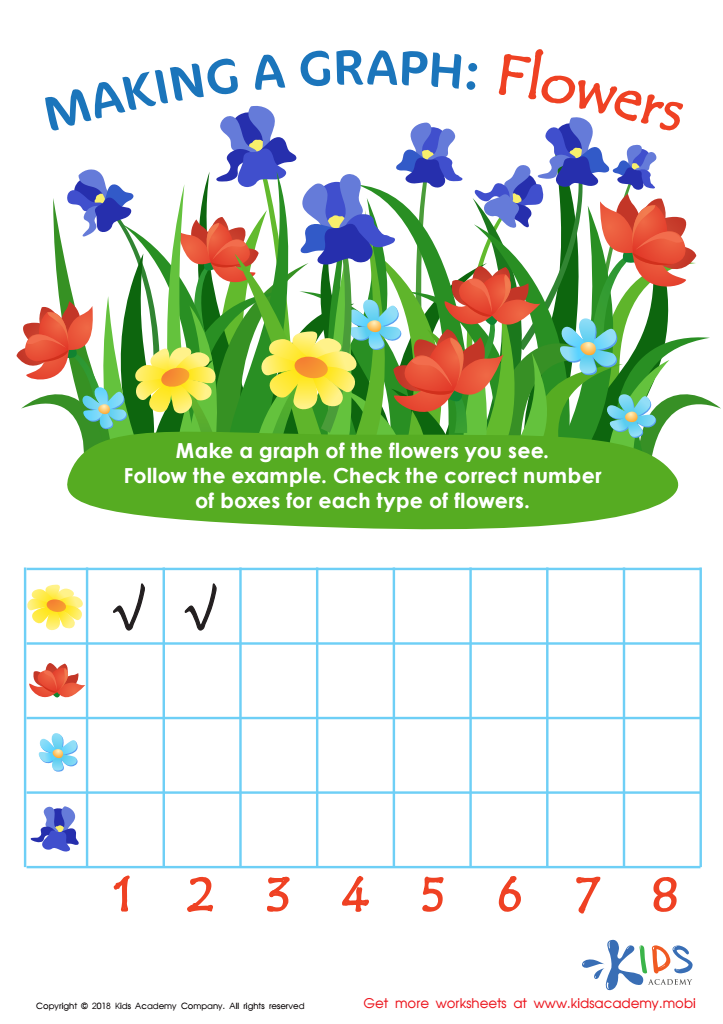
Making a Graph: Flowers Worksheet

Graph: Baby Animals Worksheet
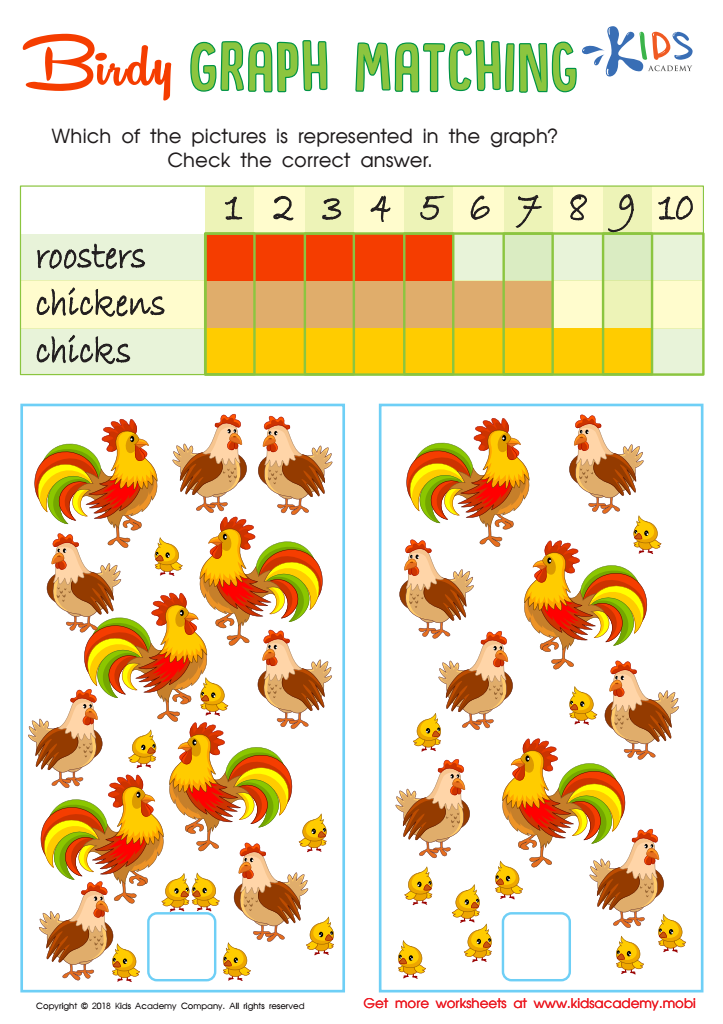
Birdy Graph Matching Worksheet


.jpg)
Parents and teachers should care about teaching graph interpretation to 7-year-olds because it lays a fundamental foundation for critical thinking, problem-solving, and data literacy. At this age, children are naturally curious and eager to make sense of the world around them. Introducing them to graphs helps harness this curiosity and transforms abstract data into tangible information they can understand.
Understanding graphs fosters essential skills like pattern recognition, comparison, and analysis. For instance, a simple bar graph showing favorite fruits helps kids see trends, such as "more kids like apples than bananas." This not only solidifies their basic math skills like counting and comparing numbers but also sharpens their ability to observe and interpret information.
Moreover, the proficiency in graph interpretation translates into better performance across various subjects. In science, they might use graphs to track plant growth or temperature changes over a week. In social studies, they can understand population charts or timelines of historical events. These applications make learning more interactive and engaging.
Additionally, early exposure to graphs helps prepare children for a data-driven world. As they grow, they'll encounter more complex data presentations in academics and everyday life. Hence, mastering the basics early on ensures they are not only consumers of information but also critical thinkers.


