Data interpretation Worksheets for 9-Year-Olds
5 filtered results
-
From - To
Welcome to our Data Interpretation Worksheets for 9-Year-Olds! Designed to engage young learners, these worksheets aim to enhance analytical skills and critical thinking through fun, interactive activities. Each worksheet presents various data sets, including graphs, charts, and tables, challenging students to extract valuable insights and answer relevant questions. These resources are perfect for homeschooling, classroom use, or supplemental practice, fostering a solid understanding of data interpretation concepts. Encourage your child’s math skills and boost their confidence with our thoughtfully crafted worksheets, providing an enjoyable learning experience. Explore our collection today and help your 9-year-old excel in data analysis!

Reading Bar Graph Worksheet
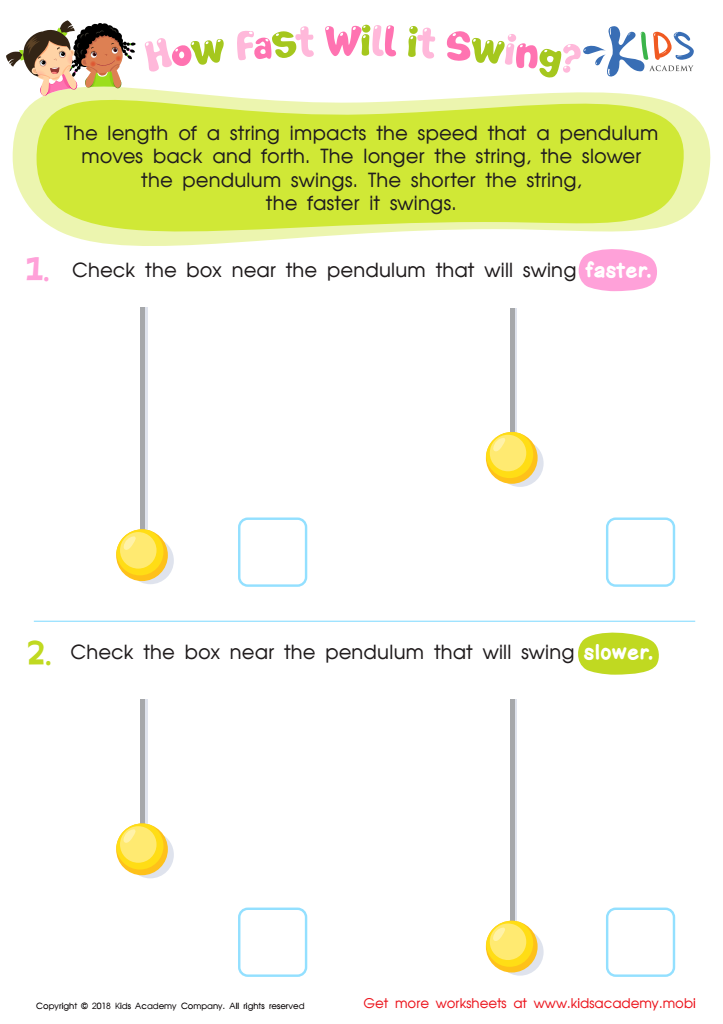
Pendulum Experiment Worksheet For 3rd Grade
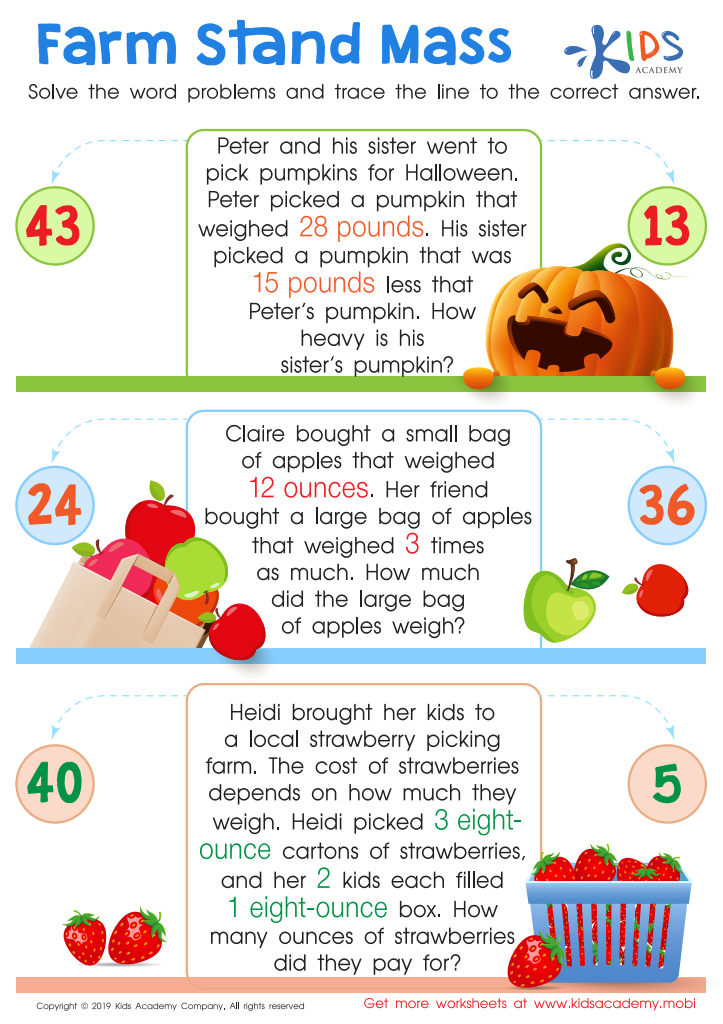
Farm Stand Mass Worksheet

Aircraft Carrier Picture Graphs Worksheet

Leaf Measure Line Plot Worksheet


Understanding data interpretation is crucial for nine-year-olds as it equips them with essential skills needed for both academic success and practical everyday decision-making. At this age, children are beginning to grasp complex concepts, and data interpretation helps develop their analytical thinking, critical reasoning, and problem-solving abilities.
Parents and teachers should care about this skill because it lays the foundation for future learning in subjects like math and science, where interpreting charts, graphs, and statistics becomes more frequent. By engaging with data at a young age, children learn to analyze trends, recognize patterns, and draw conclusions from information presented in various formats. This experience not only enhances their cognitive abilities but also fosters confidence in using data in real-life situations, such as understanding sports statistics, survey results, or environmental data.
Moreover, in an increasingly data-driven world, young learners must become competent in interpreting information to navigate and make sense of the media, research findings, and personal finance as they grow. By prioritizing data interpretation, parents and teachers contribute to developing well-rounded, informed individuals who can think critically and make informed decisions, invaluable skills in their educational journey and future careers.


