
Analyzing data Graphs Worksheets for 9-Year-Olds
4 filtered results
Difficulty Level
Grade
Age
-
From - To
Subject
Activity
Standards
Unlock your child's analytical potential with our "Analyzing Data Graphs Worksheets for 9-Year-Olds." These expertly designed worksheets are crafted to enhance critical math and science skills through interactive graph analysis activities. Perfect for third and fourth graders, our resources help young learners master interpreting bar graphs, line graphs, and pie charts, equipping them to comprehend and utilize data effectively. Each worksheet includes child-friendly exercises that promote logical thinking and data fluency in a fun, accessible manner. Inspire your 9-year-old to explore the power of data with our engaging and educational graph analysis worksheets!
Favorites
With answer key
Interactive

Recycling Picture Graph Worksheet
This worksheet can help kindergartners learn numbers and why recycling is important. After using items and materials, they can turn them into new materials instead of throwing them away. Guide your students to follow the instructions and answer the questions at the end. Help them understand how recycling benefits our environment.
Recycling Picture Graph Worksheet
Worksheet

Planets Bar Graph Worksheet
With this fun, educational worksheet, kids can learn about bar graphs and the solar system simultaneously. Introduce them to the concept by reading out the number of miles for each planet, then help them trace the dashed lines in each bar to complete the graph.
Planets Bar Graph Worksheet
Worksheet
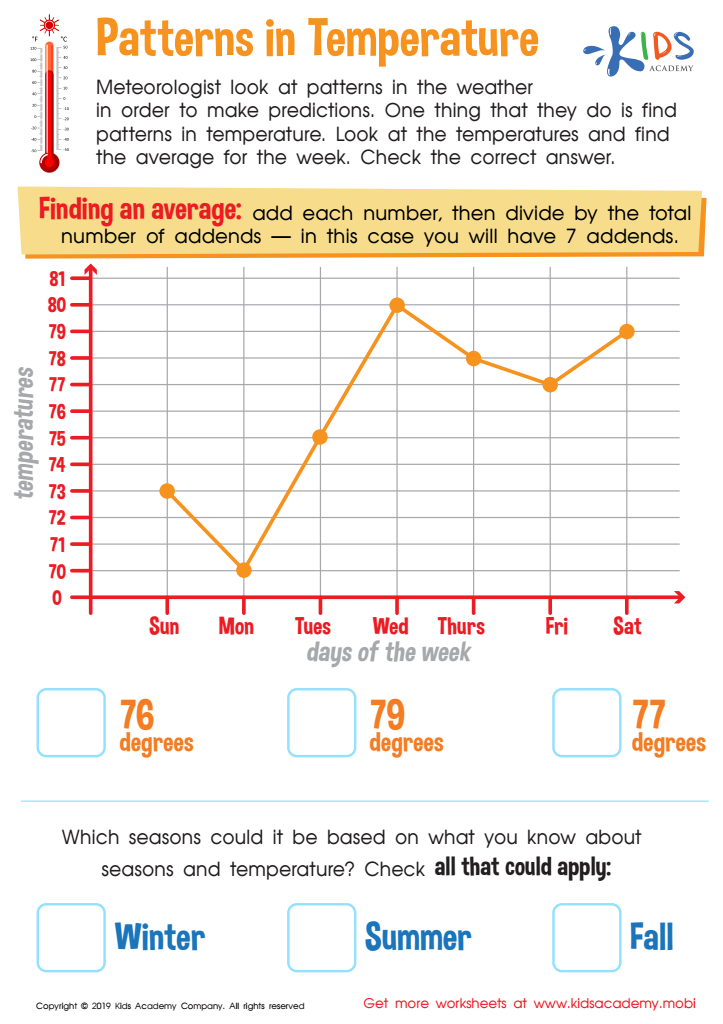
Patterns in Temperature Worksheet
Kids need to learn how to read and interpret data from graphs and charts. This free worksheet on temperature patterns helps them to do just that. They'll practice finding averages and answer questions in multiple-choice format. Plus, it provides a great learning experience!
Patterns in Temperature Worksheet
Worksheet

Egyptian Bar Graph Worksheet
Help your kids get a hang of bar graphs with this fun worksheet. Examine the picture of the ancient pyramids and help them match the bar graph to it. Check the box next to the correct bar graph and watch your little ones learn quickly!
Egyptian Bar Graph Worksheet
Worksheet
Join Kids Academy for Free
Who is primarily going to use this learning content?


Analyzing data graphs for 9-year-olds is crucial for several developmental reasons. Firstly, it introduces children to essential life skills that they will use throughout their education and into adulthood. Learning to interpret and analyze data from graphs helps children develop critical thinking and problem-solving skills. These are pivotal for making informed decisions based on evidence, a practice that extends far beyond the classroom.
Understanding graphs also enhances mathematical literacy. At an early age, children begin to navigate the world of numbers, percentages, and statistical references. Mastering these skills in a visual and engaging way bridges the gap between abstract numerical concepts and their practical applications.
Furthermore, being proficient in graph analysis nurtures a child’s ability to communicate complex information succinctly and clearly. In today’s data-driven world, this is an indispensable skill, contributing to effective communication in both professional and personal contexts.
Parents and teachers should also care because fostering familiarity with data visualization early on can inspire a positive attitude toward STEM (Science, Technology, Engineering, and Mathematics) subjects. This can lead to sustained interest and better academic performance in these areas over time. Thus, investing in graph analysis education ensures a well-rounded development, equipping children with tools needed for future success.


