Graphs Worksheets for Ages 6-8 - Page 2
27 filtered results
-
From - To
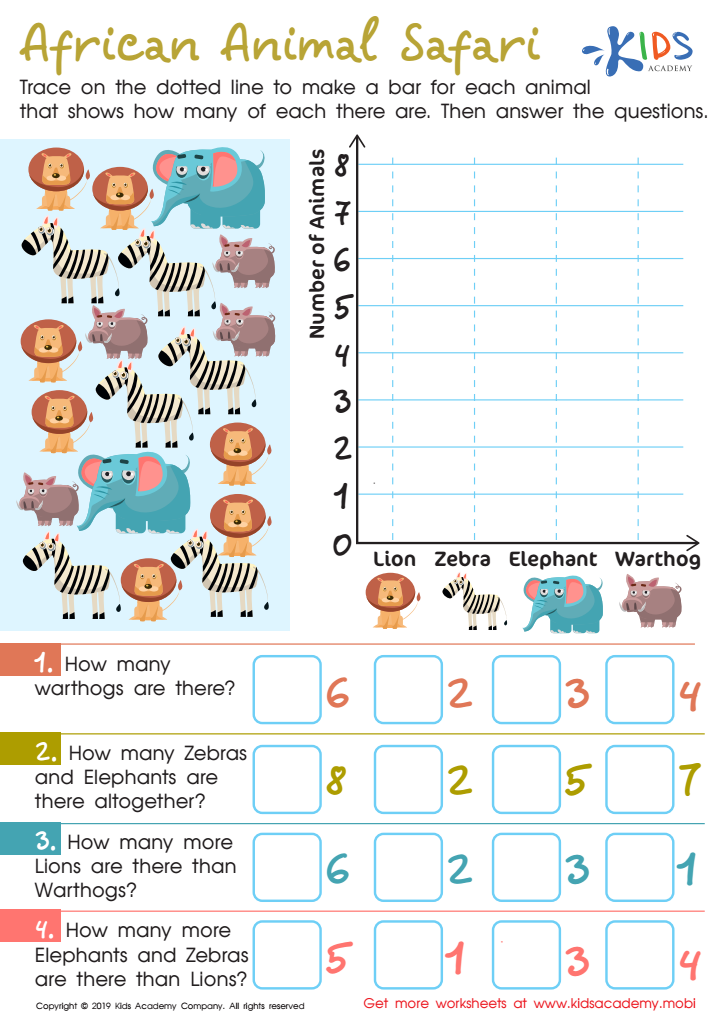
African Animal Safari Worksheet

Leaf Measure Line Plot Worksheet

Football Math Worksheet


Parents and teachers should care about introducing graphs to children aged 6-8 for several compelling reasons. Firstly, graphs serve as powerful visual tools that help young learners organize and interpret data, fostering critical thinking and analytical skills. By learning to read and create graphs, children can better comprehend relationships and trends, enabling them to make informed decisions in their everyday lives.
Moreover, understanding graphs supports the development of mathematical concepts such as counting, addition, and comparison. This age group is particularly responsive to visual representation; thus, engaging with graphs makes abstract maths concepts more tangible and enjoyable. It also enhances their ability to communicate findings effectively, as they learn to describe and discuss charted information.
Additionally, familiarizing children with graphs can cultivate curiosity about the world around them. Whether tracking favorite fruits in class, weather patterns over weeks, or reviewing sports statistics, graphing activities encourage exploration and connection to real-life situations. This integration of learning through visual and interactive methods lays a strong foundation for future academic success, while also promoting enthusiasm for mathematics and data analysis early on. Adopting this approach not only enhances cognitive skills, but also empowers students to express their ideas creatively.


