Interpreting data Easy Worksheets for Ages 3-7
3 filtered results
Difficulty Level
Grade
Age
-
From - To
Subject
Activity
Standards
Welcome to our "Interpreting Data Easy Worksheets for Ages 3-7"! Designed specifically for young learners, these engaging worksheets help children develop essential data interpretation skills through fun and interactive activities. From bar graphs to pictographs, each worksheet introduces basic concepts of data collection and representation in a playful manner that's suitable for early education. Ideal for preschool and kindergarten classrooms, our resources support critical thinking and problem-solving in a visually stimulating format. Watch your child's confidence grow as they explore patterns, trends, and comparisons. Start nurturing their data literacy today—perfect for home or classroom learning!
Favorites
With answer key
Interactive

Pencil Case Line Plot Worksheet
Explain to your child that a line plot is a way to organize information. For example, if they need to arrange objects, they should draw a line plot. Now, have them help Tom measure the objects in his pencil case in inches. Then, have them check the line plot that accurately shows the length.
Pencil Case Line Plot Worksheet
Worksheet
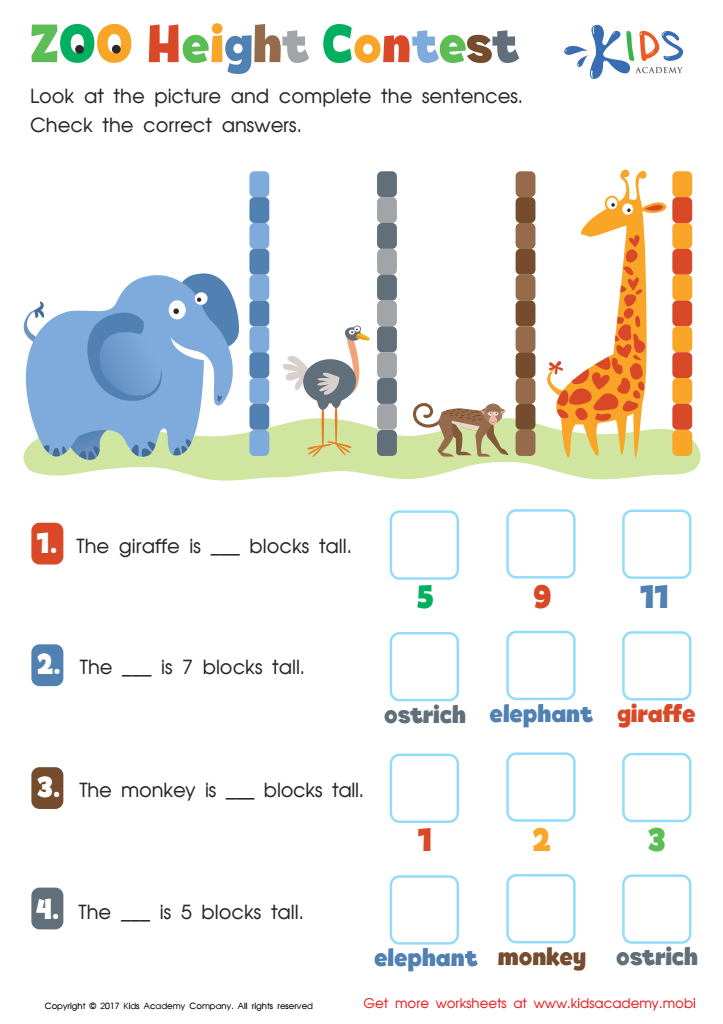
Zoo Height Contest Worksheet
Let's head to the zoo and use colorful blocks to measure your child's favorite animals! With this Kids Academy worksheet, help them practice and prepare for learning measurement. Guide them in looking at the zoo animals and counting blocks to find the height. Then, read the questions and check the box next to the correct answer.
Zoo Height Contest Worksheet
Worksheet

Family Line Plot Worksheet
Have you and your kids ever done a family height measurement? How did it go? If they're familiar with it, this worksheet may be simpler. The picture shows a family with their heights recorded. Get your kid to look at the line plots and choose the one that shows the family's heights accurately.
Family Line Plot Worksheet
Worksheet
Join Kids Academy for Free
Who is primarily going to use this learning content?


.jpg)


Interpreting data is essential for parents and teachers of young children aged 3-7 because it helps them understand each child's learning progress, strengths, and areas needing support. At this age, children are at a critical stage of development, and data can provide valuable insights into how well they are grasping foundational skills in literacy, math, and social interactions.
For parents, understanding their child's data can facilitate meaningful discussions with teachers about ways to support homework, reading, and other activities at home. This promotes a partnership that strengthens the child’s educational experience.
Teachers can use data to tailor their lesson plans, ensuring that instruction meets the varied needs of their students. By recognizing patterns in a child's progress, teachers can adapt their teaching strategies, fostering a more inclusive classroom environment.
In addition, interpreting data can lead to early interventions when needed, helping to address potential challenges before they become significant issues. Overall, when parents and teachers work together to understand and use data effectively, they create a supportive foundation for children’s future learning and growth, ensuring they thrive during these formative years.