Understanding line plots Easy Math Worksheets for Ages 6-8
8 filtered results
-
From - To
Welcome to "Understanding Line Plots: Easy Math Worksheets for Ages 6-8"! Our engaging worksheets are designed to help young learners grasp the concept of line plots in a fun and accessible way. Tailored for children aged 6 to 8, these instructional materials introduce basic elements of data visualization, allowing students to organize and interpret data effectively. With a variety of interactive exercises, kids will practice reading and creating line plots, enhancing their math skills in a creative environment. Perfect for classroom use or at home, these worksheets make learning about line plots enjoyable and straightforward for early learners. Dive into math with confidence!

What Is a Line Plot? Worksheet

Students Line Plot Worksheet
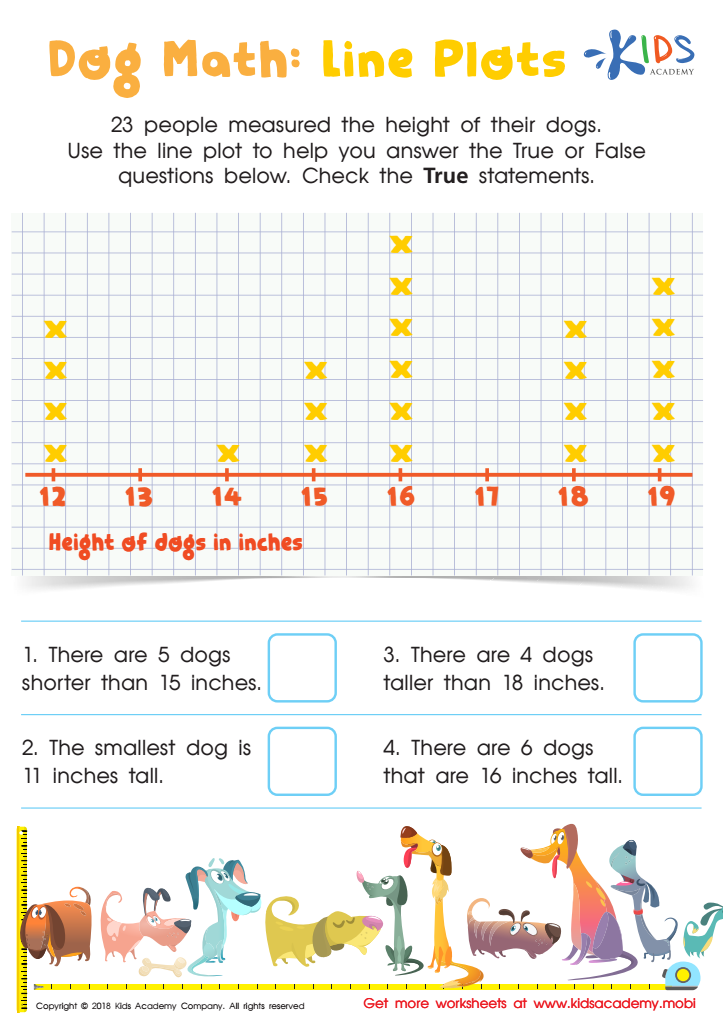
Dog Math: Line Plots Worksheet

Pencil Case Line Plot Worksheet
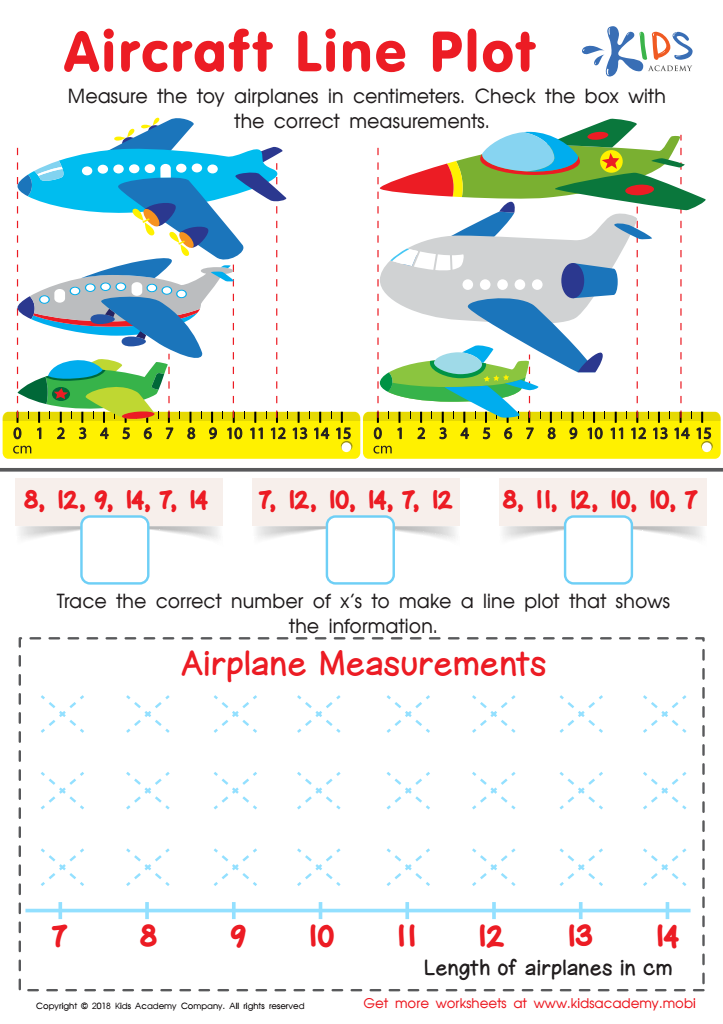
Aircraft Line Plot Worksheet
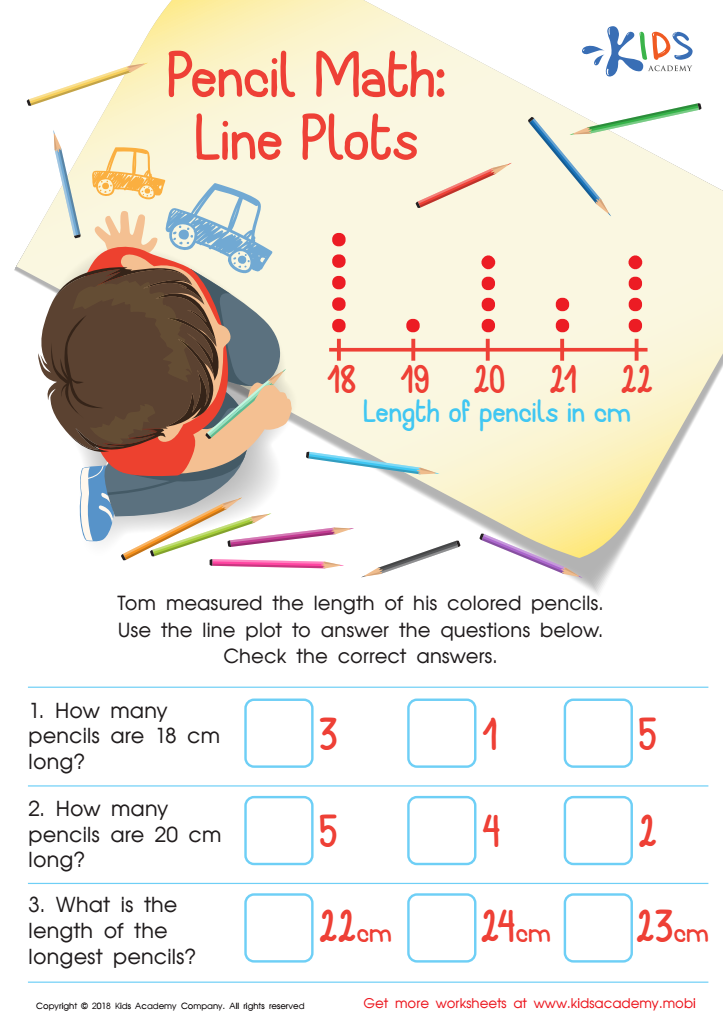
Pencil Math: Line Plots Worksheet

Family Line Plot Worksheet
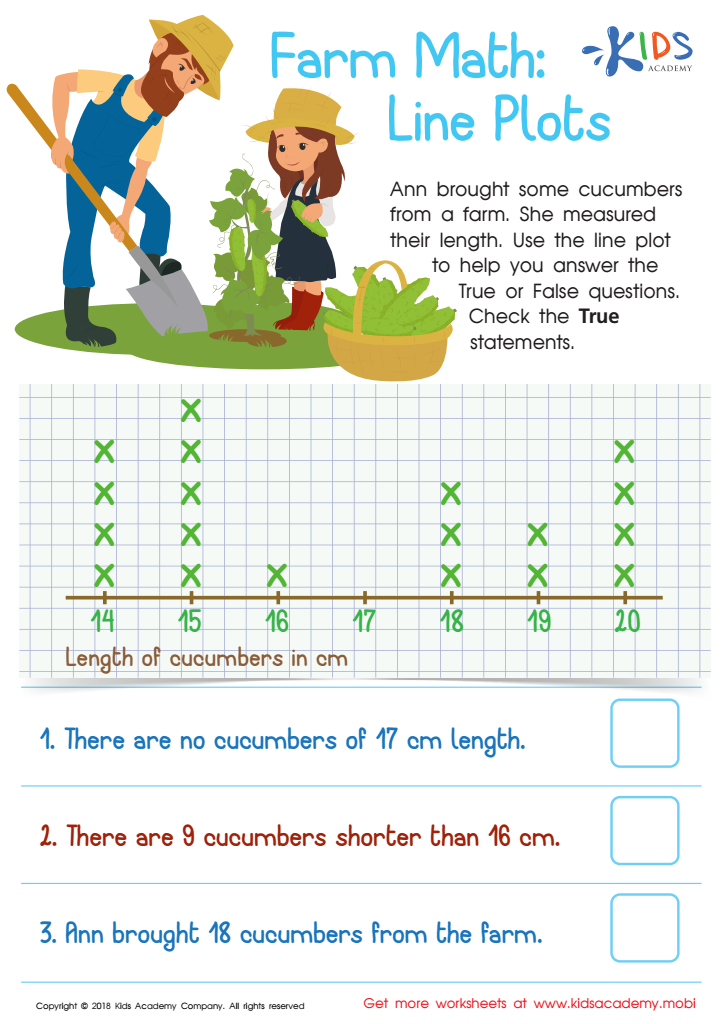
Farm Math: Line Plots Worksheet


Understanding line plots is crucial for children aged 6-8, as it forms a foundation for their mathematical development and data literacy. Line plots help young learners visualize and interpret data, fostering critical thinking and analytical skills. By engaging with this type of data representation, children learn to observe patterns, trends, and comparisons, which are essential skills not just in math, but in everyday decision-making.
For parents and teachers, supporting children in mastering line plots enhances their confidence and curiosity in math, making learning more enjoyable. It allows educators to introduce concepts like measurement, graphing, and statistics in a relatable and tangible way.
Additionally, early exposure to line plots can bridge the gap to more complex concepts later on, ensuring students are prepared for advanced mathematics. For parents, understanding what their children are learning helps them to assist with homework and foster a supportive learning environment at home. By caring about line plots, parents and teachers together can cultivate a more mathematically inclined generation, highlighting the importance of teamwork in education. Overall, appreciating and teaching line plots provides a rich resource for engaging young learners in the wonders of math.