Understanding line plots Easy Math Worksheets for Ages 8-9
8 filtered results
-
From - To
Introduce your young learners to the basics of data interpretation with our "Understanding Line Plots: Easy Math Worksheets for Ages 8-9." These specially designed worksheets help children grasp the concept of line plots through engaging, easy-to-follow exercises. Perfect for 3rd graders, the activities involve plotting data, reading graphs, and answering questions, making learning fun and effective. Whether used at home or in the classroom, these worksheets enhance critical thinking and math skills, laying a strong foundation for future data analysis. Visit our page for a hands-on approach to mastering line plots, and watch your child’s confidence grow!

What Is a Line Plot? Worksheet

Students Line Plot Worksheet
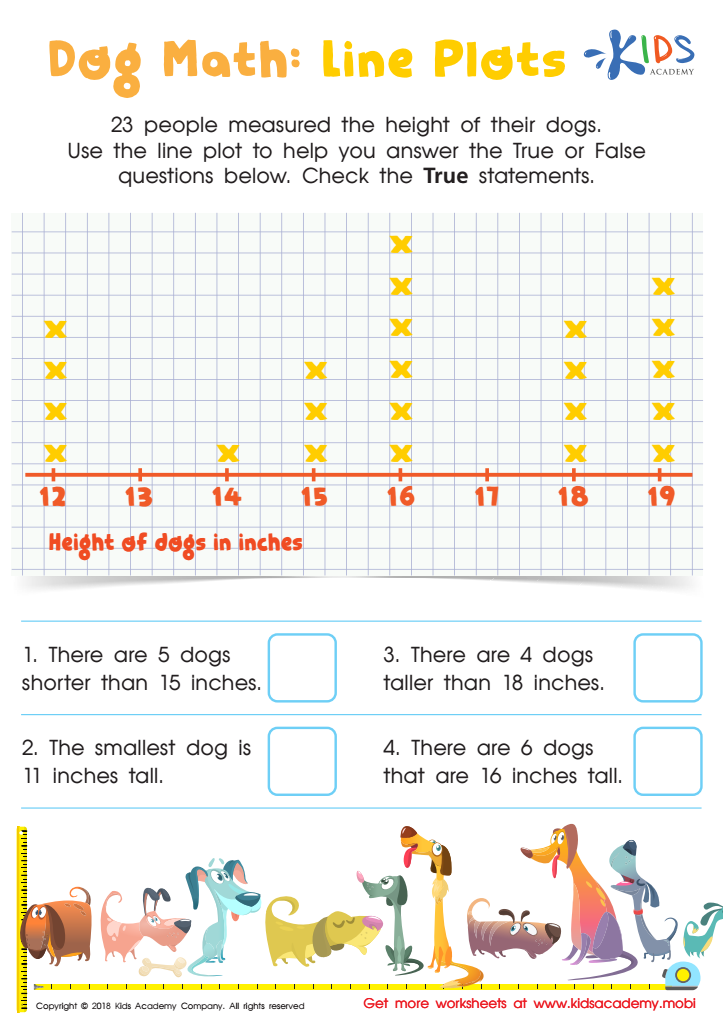
Dog Math: Line Plots Worksheet

Pencil Case Line Plot Worksheet
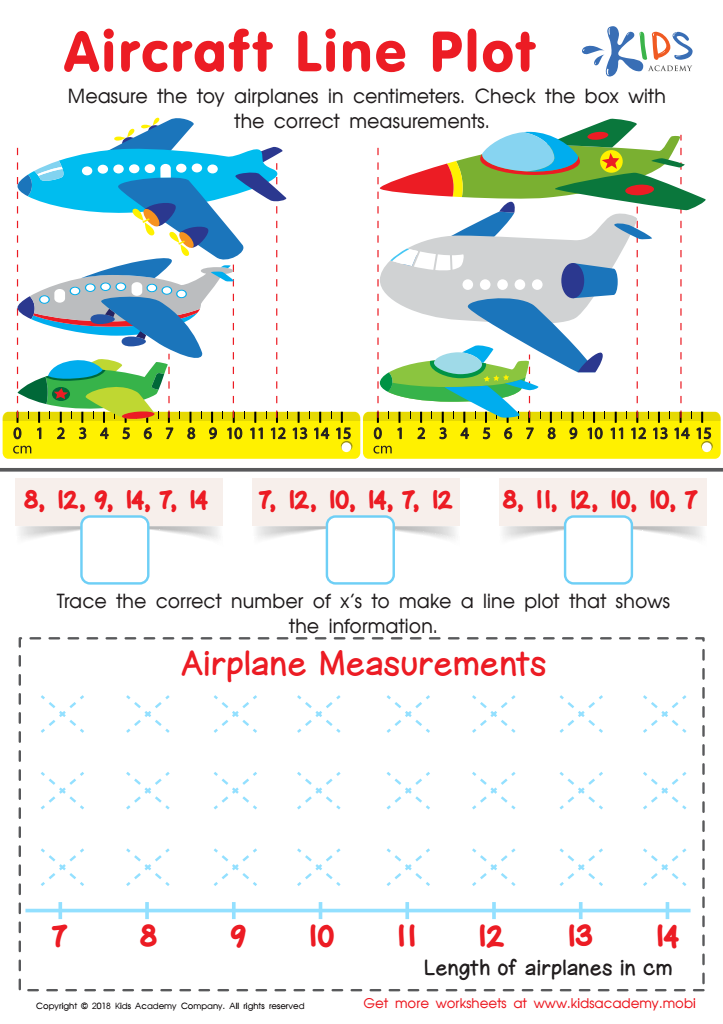
Aircraft Line Plot Worksheet
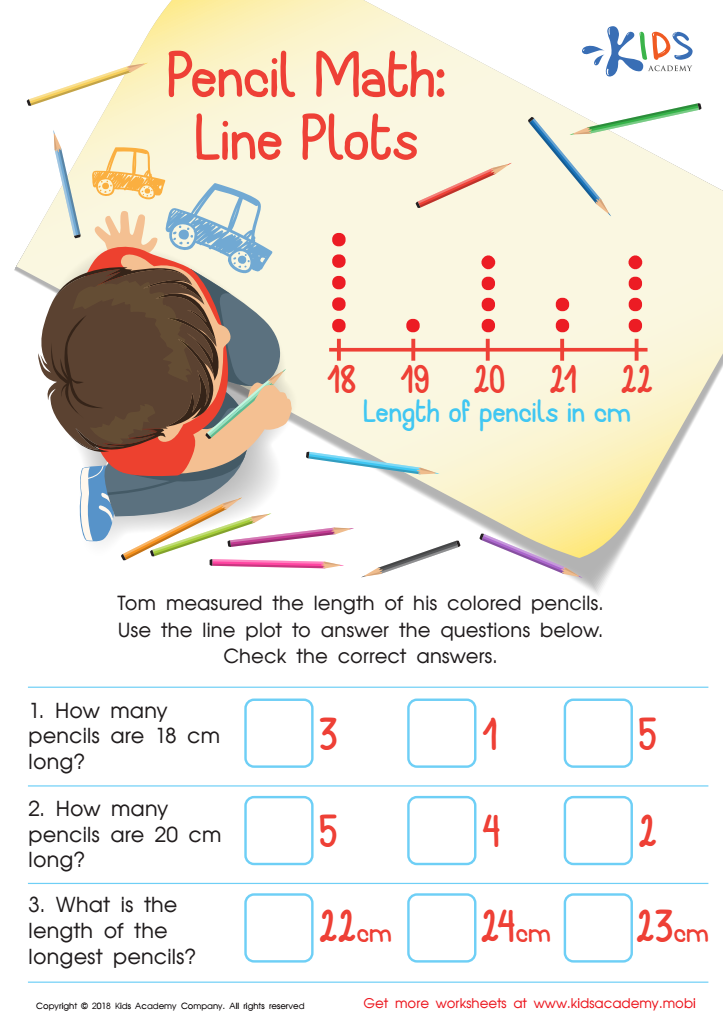
Pencil Math: Line Plots Worksheet

Family Line Plot Worksheet
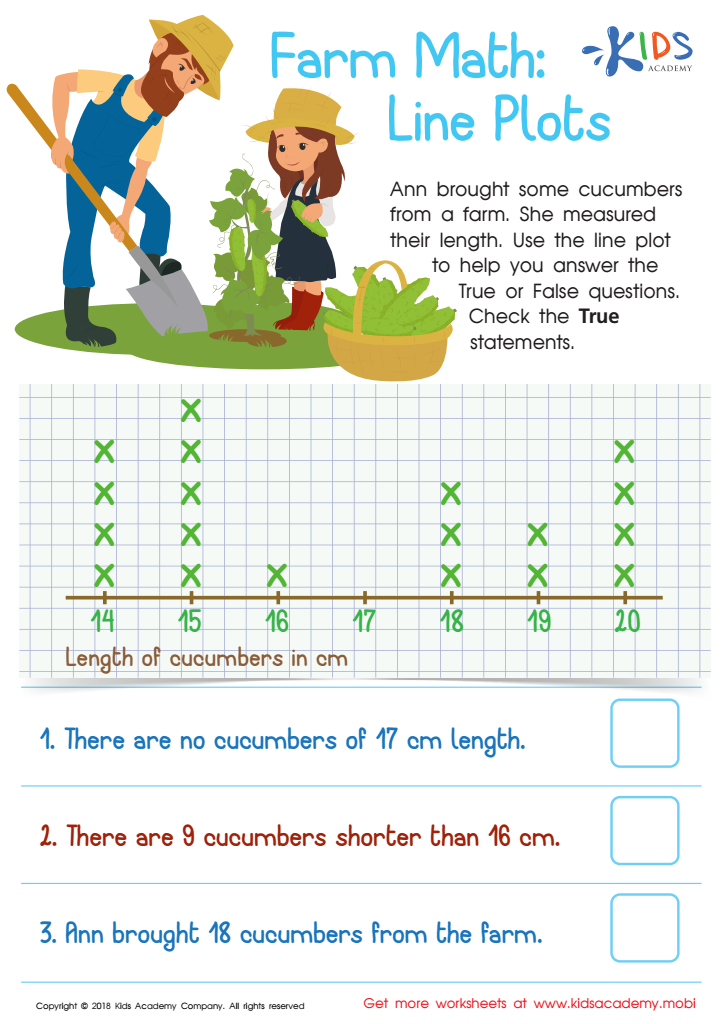
Farm Math: Line Plots Worksheet


Parents and teachers should care about teaching line plots to children ages 8-9 because it nurtures foundational mathematical and analytical skills that are critical for future success. At this age, children are rapidly developing their cognitive abilities and are able to grasp concepts that will be essential for more complex mathematics and real-life problem-solving later on.
Line plots offer a visual way to represent data, making abstract numerical concepts more concrete and understandable. This early introduction helps students to learn data interpretation, which involves recognizing patterns, trends, and making logical inferences—all vital skills in a data-driven world. By learning to read and create line plots, children also enhance their ability to compare numbers, a basic yet significant array of skills spanning various math topics including statistics, probability, and algebra.
Furthermore, mastering line plots contributes to improved critical thinking and decision-making skills. Children learn to analyze information, ask relevant questions, and draw conclusions—competencies that are applicable in daily life. In the classroom, it encourages collaborative learning as students collect, share, and discuss data points.
Lastly, familiarity with line plots at a young age can boost self-confidence, as children proudly engage in tasks that involve interpretation and presentation of their data. This paves the way for a positive attitude towards mathematics, fostering a lifelong love and understanding of the subject.