Data interpretation Easy Grade 2 Worksheets
7 filtered results
-
From - To
Welcome to our Data Interpretation Easy Grade 2 Worksheets page! Designed to make learning fun and engaging for second graders, these worksheets help young learners develop essential data interpretation skills. With colorful visuals and relatable scenarios, students practice reading charts, graphs, and pictograms while sharpening their critical thinking abilities. Each worksheet is thoughtfully crafted to reinforce understanding of fundamental concepts in a simple, enjoyable manner. Perfect for classroom activities or at-home practice, these resources empower children to analyze information effectively, fostering confidence in their math skills. Explore our collection today and inspire your child's love for learning through data interpretation!

Fruit Math: Picture Graphs Worksheet

Students Line Plot Worksheet
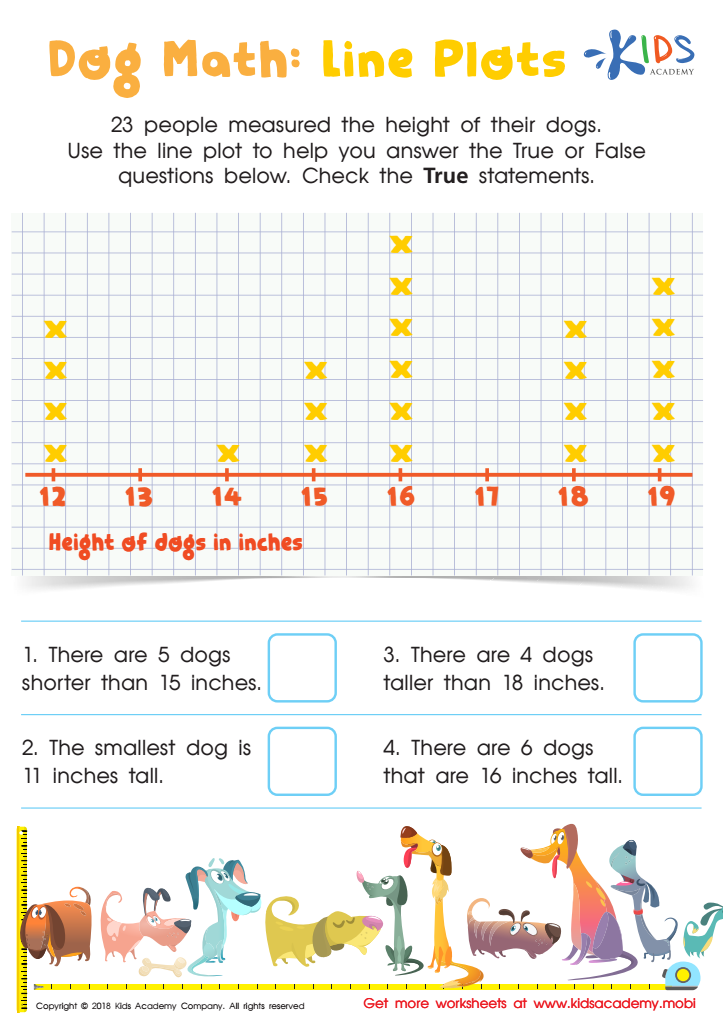
Dog Math: Line Plots Worksheet
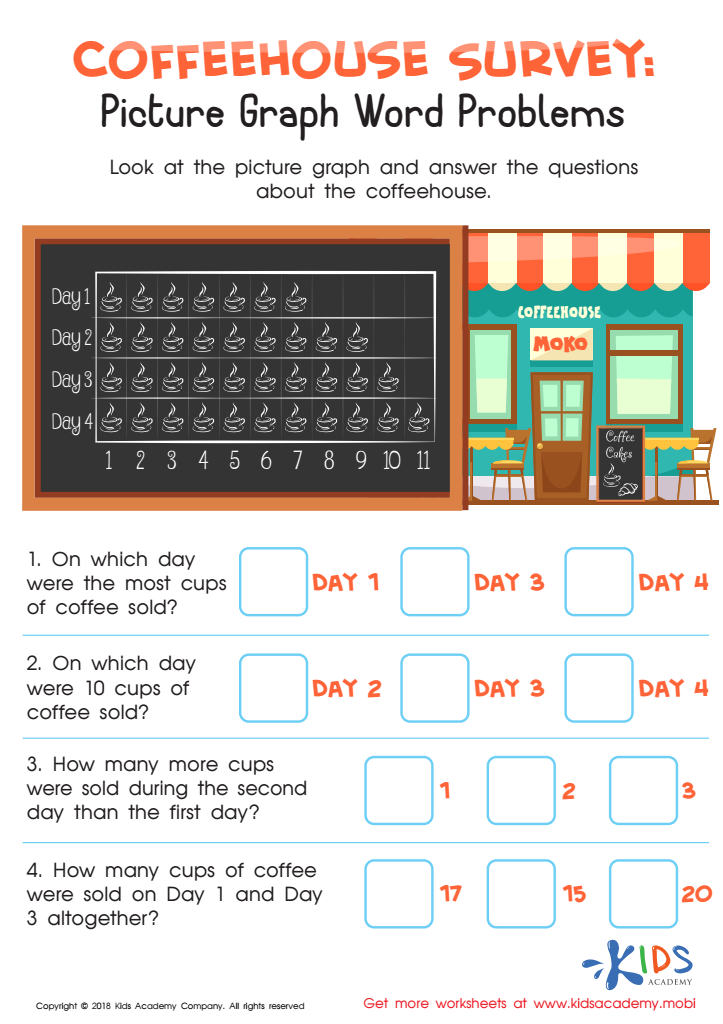
Coffeehouse Survey: Picture Graph Word Problems Worksheet
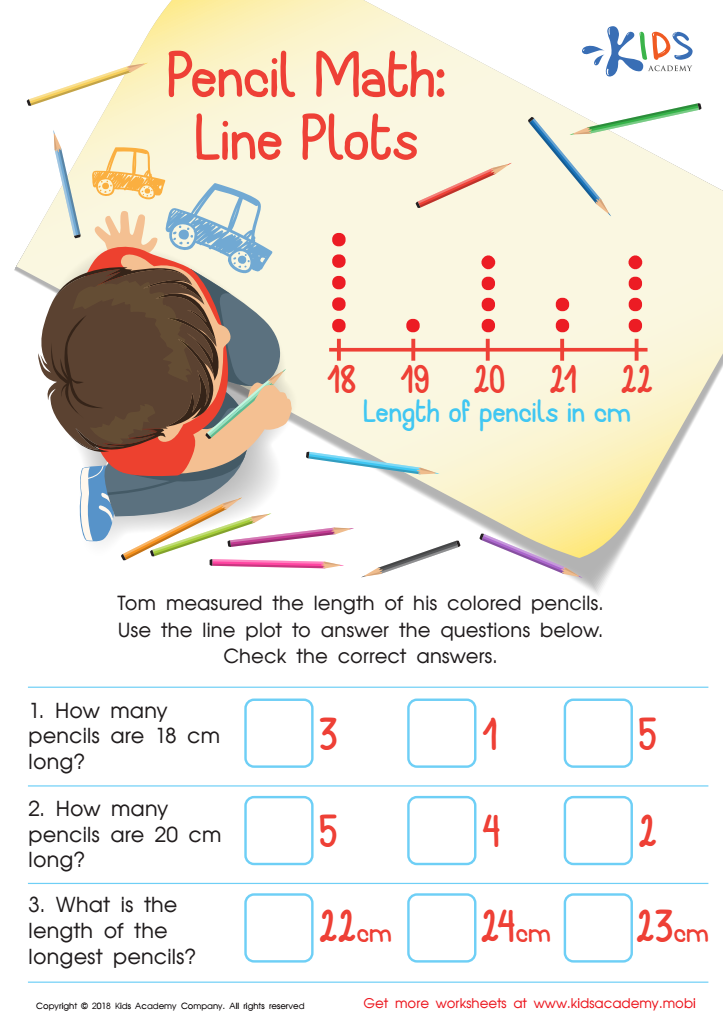
Pencil Math: Line Plots Worksheet
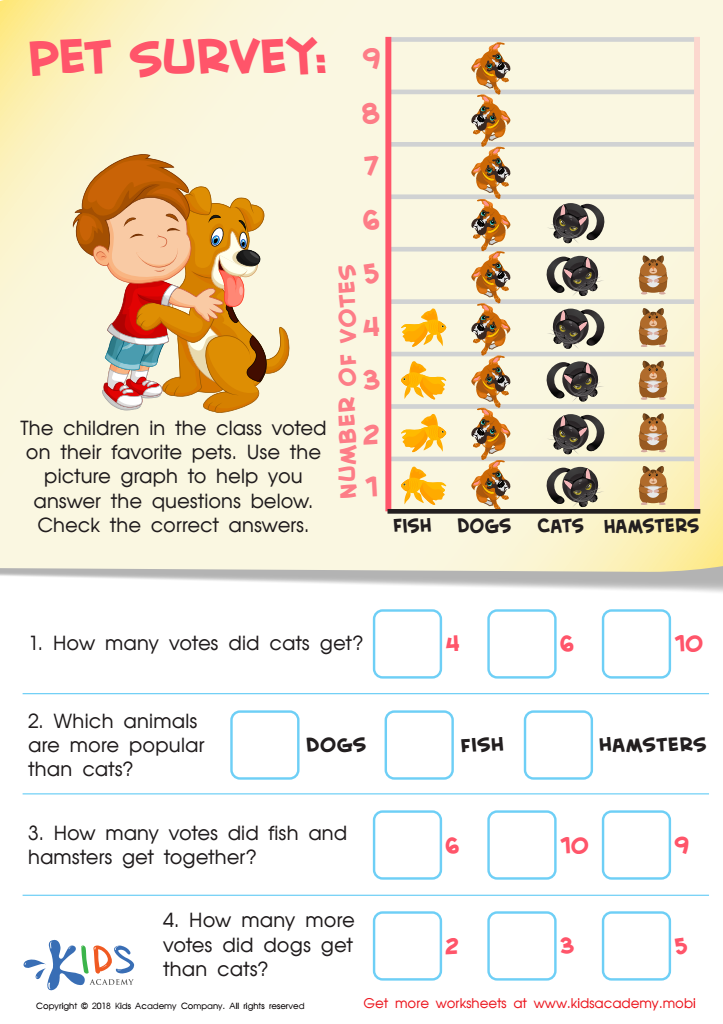
Pet Survey Worksheet
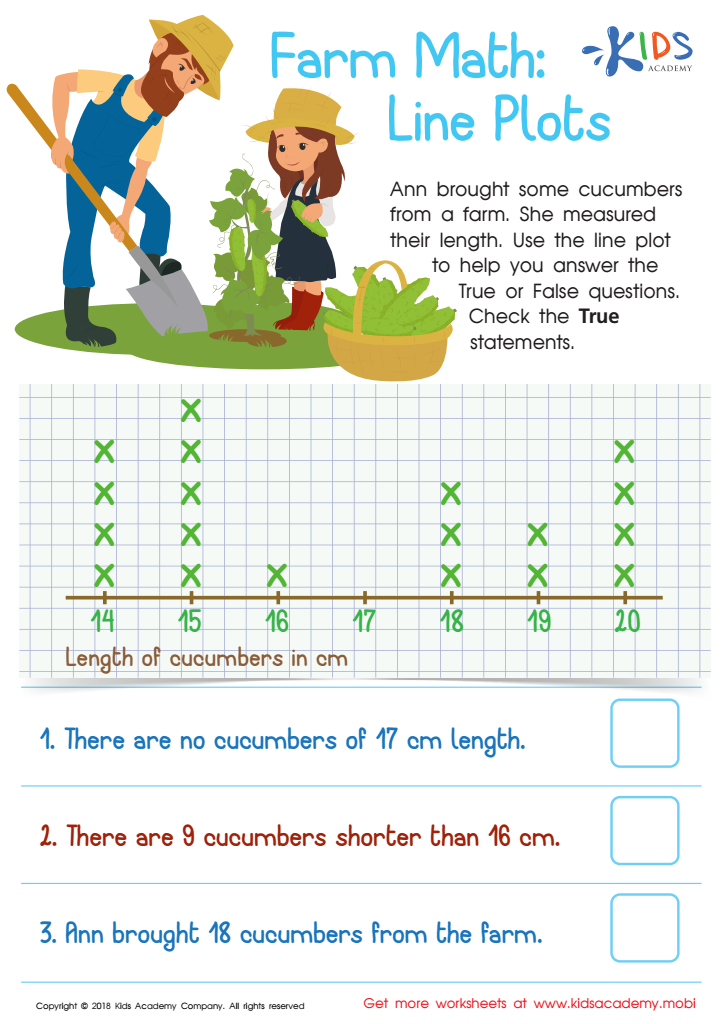
Farm Math: Line Plots Worksheet


Data interpretation is a crucial skill for second graders that parents and teachers should prioritize. Understanding data helps children make sense of the world around them. From gathering information through charts to interpreting simple graphs, these skills empower young learners to analyze everyday situations, such as sports statistics or survey results in class.
Fostering data interpretation skills also encourages critical thinking and problem-solving. As children practice organizing and interpreting information, they learn to draw conclusions, make predictions, and support their ideas with evidence. This process promotes cognitive development and enhances their ability to communicate effectively.
Moreover, data interpretation lays the foundation for future math skills. Concepts discovered in early grades—like sorting, counting, and comparing—introduce essential mathematical reasoning that becomes increasingly complex in higher grades. Parents and teachers can make learning engaging by incorporating activities, such as using real-life data collection through family surveys or school projects, thus making math relevant.
Additionally, these skills instill a sense of curiosity and empower students to express their opinions based on observed facts. By valuing data interpretation, caregivers set children on a path toward informed decision-making and lifelong learning.