Interpretation of bar graph Worksheets for Kids
1 filtered results
-
From - To
Question/Answer
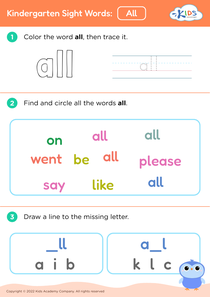
What are some effective activities to train students’ Interpretation of bar graph skill when teaching them about Sight Words?
Create a bar graph with sight words as categories, where each bar represents the frequency of each word found in a text. Have students interpret the graph by identifying the most and least common sight words, compare frequencies, and correlate sight words to their usage. This activity improves both sight word recognition and graph interpretation skills.
How to test a Kindergarten student’s Interpretation of bar graph skills?
To test a Kindergarten student's interpretation of bar graph skills, present a simple bar graph with visual aids, such as pictures of fruits or animals, using minimal categories. Ask the student to identify which category has the most or least items and to count the items in each category. Use clear and straightforward questions to assess their understanding.
What does the Interpretation of bar graph skill mean when it comes to Kindergarten Sight Words learning?
The Interpretation of bar graph skill, in relation to Kindergarten Sight Words learning, typically means the ability to understand simple visual data representations related to sight words. For example, a bar graph might be used to show how often certain sight words appear in a text, helping kindergarteners visually grasp word frequency and prioritize their learning.
